
Advertisement

Legendary fund manager Li Lu (who Charlie Munger backed) once said, 'The biggest investment risk is not the volatility of prices, but whether you will suffer a permanent loss of capital.' It's only natural to consider a company's balance sheet when you examine how risky it is, since debt is often involved when a business collapses. We note that Poplar Co., Ltd. (TSE:7601) does have debt on its balance sheet. But the more important question is: how much risk is that debt creating?
When Is Debt Dangerous?
Debt assists a business until the business has trouble paying it off, either with new capital or with free cash flow. If things get really bad, the lenders can take control of the business. While that is not too common, we often do see indebted companies permanently diluting shareholders because lenders force them to raise capital at a distressed price. Of course, debt can be an important tool in businesses, particularly capital heavy businesses. The first thing to do when considering how much debt a business uses is to look at its cash and debt together.
See our latest analysis for Poplar
How Much Debt Does Poplar Carry?
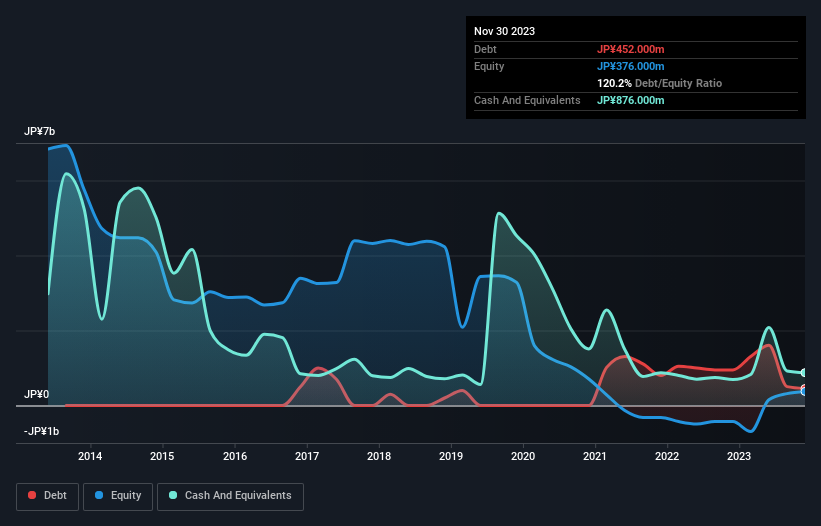
As you can see below, Poplar had JP¥452.0m of debt at November 2023, down from JP¥948.0m a year prior. However, its balance sheet shows it holds JP¥876.0m in cash, so it actually has JP¥424.0m net cash.
How Healthy Is Poplar's Balance Sheet?
We can see from the most recent balance sheet that Poplar had liabilities of JP¥1.78b falling due within a year, and liabilities of JP¥1.83b due beyond that. Offsetting this, it had JP¥876.0m in cash and JP¥52.0m in receivables that were due within 12 months. So its liabilities total JP¥2.69b more than the combination of its cash and short-term receivables.
This is a mountain of leverage relative to its market capitalization of JP¥2.71b. Should its lenders demand that it shore up the balance sheet, shareholders would likely face severe dilution. Despite its noteworthy liabilities, Poplar boasts net cash, so it's fair to say it does not have a heavy debt load!
It was also good to see that despite losing money on the EBIT line last year, Poplar turned things around in the last 12 months, delivering and EBIT of JP¥355m. When analysing debt levels, the balance sheet is the obvious place to start. But you can't view debt in total isolation; since Poplar will need earnings to service that debt. So when considering debt, it's definitely worth looking at the earnings trend. Click here for an interactive snapshot.
Finally, a business needs free cash flow to pay off debt; accounting profits just don't cut it. While Poplar has net cash on its balance sheet, it's still worth taking a look at its ability to convert earnings before interest and tax (EBIT) to free cash flow, to help us understand how quickly it is building (or eroding) that cash balance. Over the last year, Poplar saw substantial negative free cash flow, in total. While investors are no doubt expecting a reversal of that situation in due course, it clearly does mean its use of debt is more risky.
Summing Up
While Poplar does have more liabilities than liquid assets, it also has net cash of JP¥424.0m. Despite its cash we think that Poplar seems to struggle to convert EBIT to free cash flow, so we are wary of the stock. There's no doubt that we learn most about debt from the balance sheet. But ultimately, every company can contain risks that exist outside of the balance sheet. Case in point: We've spotted 3 warning signs for Poplar you should be aware of, and 1 of them can't be ignored.
When all is said and done, sometimes its easier to focus on companies that don't even need debt. Readers can access a list of growth stocks with zero net debt 100% free, right now.
New: Manage All Your Stock Portfolios in One Place
We've created the ultimate portfolio companion for stock investors, and it's free.
• Connect an unlimited number of Portfolios and see your total in one currency
• Be alerted to new Warning Signs or Risks via email or mobile
• Track the Fair Value of your stocks
Have feedback on this article? Concerned about the content? Get in touch with us directly. Alternatively, email editorial-team (at) simplywallst.com.
This article by Simply Wall St is general in nature. We provide commentary based on historical data and analyst forecasts only using an unbiased methodology and our articles are not intended to be financial advice. It does not constitute a recommendation to buy or sell any stock, and does not take account of your objectives, or your financial situation. We aim to bring you long-term focused analysis driven by fundamental data. Note that our analysis may not factor in the latest price-sensitive company announcements or qualitative material. Simply Wall St has no position in any stocks mentioned.
About TSE:7601
Flawless balance sheet and good value.
Market Insights

Advertisement
Community Narratives
Pinterest will surge as advertising innovations ignite revenue growth
Fair Value US$42.63|27.0% undervalued
BR
Community Contributor
Brambles' Revenue Set to Climb 14% with Profit Margins Following
Fair Value AU$21.90|5.9% overvalued
RO
Community Contributor
Challenging Future for STG as Organic Sales Decline by 8.8%
Fair Value DKK 116.13|26.8% undervalued
KA
Community Contributor