
Advertisement
- Japan
- /
- Food and Staples Retail
- /
- TSE:3141
Welcia Holdings Co., Ltd. (TSE:3141) Stock Has Shown Weakness Lately But Financials Look Strong: Should Prospective Shareholders Make The Leap?

It is hard to get excited after looking at Welcia Holdings' (TSE:3141) recent performance, when its stock has declined 21% over the past three months. But if you pay close attention, you might gather that its strong financials could mean that the stock could potentially see an increase in value in the long-term, given how markets usually reward companies with good financial health. In this article, we decided to focus on Welcia Holdings' ROE.
Return on equity or ROE is a key measure used to assess how efficiently a company's management is utilizing the company's capital. Simply put, it is used to assess the profitability of a company in relation to its equity capital.
Check out our latest analysis for Welcia Holdings
How To Calculate Return On Equity?
ROE can be calculated by using the formula:
Return on Equity = Net Profit (from continuing operations) ÷ Shareholders' Equity
So, based on the above formula, the ROE for Welcia Holdings is:
11% = JP¥26b ÷ JP¥244b (Based on the trailing twelve months to February 2024).
The 'return' is the yearly profit. Another way to think of that is that for every ¥1 worth of equity, the company was able to earn ¥0.11 in profit.
What Has ROE Got To Do With Earnings Growth?
Thus far, we have learned that ROE measures how efficiently a company is generating its profits. Depending on how much of these profits the company reinvests or "retains", and how effectively it does so, we are then able to assess a company’s earnings growth potential. Assuming everything else remains unchanged, the higher the ROE and profit retention, the higher the growth rate of a company compared to companies that don't necessarily bear these characteristics.
A Side By Side comparison of Welcia Holdings' Earnings Growth And 11% ROE
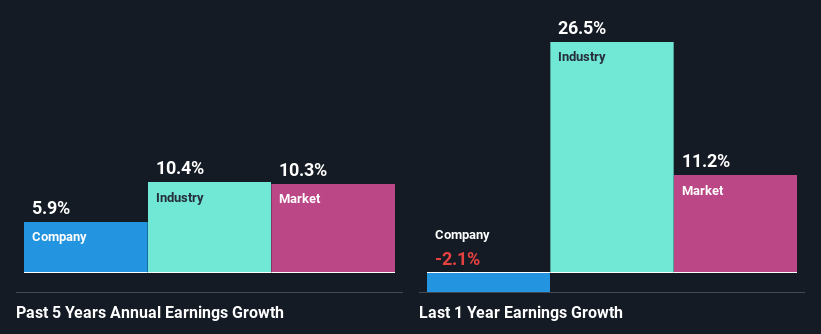
To start with, Welcia Holdings' ROE looks acceptable. Further, the company's ROE compares quite favorably to the industry average of 8.8%. This probably laid the ground for Welcia Holdings' moderate 5.9% net income growth seen over the past five years.
As a next step, we compared Welcia Holdings' net income growth with the industry and were disappointed to see that the company's growth is lower than the industry average growth of 10% in the same period.
Earnings growth is a huge factor in stock valuation. What investors need to determine next is if the expected earnings growth, or the lack of it, is already built into the share price. This then helps them determine if the stock is placed for a bright or bleak future. What is 3141 worth today? The intrinsic value infographic in our free research report helps visualize whether 3141 is currently mispriced by the market.
Is Welcia Holdings Using Its Retained Earnings Effectively?
Welcia Holdings' three-year median payout ratio to shareholders is 24% (implying that it retains 76% of its income), which is on the lower side, so it seems like the management is reinvesting profits heavily to grow its business.
Additionally, Welcia Holdings has paid dividends over a period of at least ten years which means that the company is pretty serious about sharing its profits with shareholders.
Summary
Overall, we are quite pleased with Welcia Holdings' performance. In particular, it's great to see that the company is investing heavily into its business and along with a high rate of return, that has resulted in a respectable growth in its earnings. That being so, a study of the latest analyst forecasts show that the company is expected to see a slowdown in its future earnings growth. Are these analysts expectations based on the broad expectations for the industry, or on the company's fundamentals? Click here to be taken to our analyst's forecasts page for the company.
Valuation is complex, but we're here to simplify it.
Discover if Welcia Holdings might be undervalued or overvalued with our detailed analysis, featuring fair value estimates, potential risks, dividends, insider trades, and its financial condition.
Access Free AnalysisHave feedback on this article? Concerned about the content? Get in touch with us directly. Alternatively, email editorial-team (at) simplywallst.com.
This article by Simply Wall St is general in nature. We provide commentary based on historical data and analyst forecasts only using an unbiased methodology and our articles are not intended to be financial advice. It does not constitute a recommendation to buy or sell any stock, and does not take account of your objectives, or your financial situation. We aim to bring you long-term focused analysis driven by fundamental data. Note that our analysis may not factor in the latest price-sensitive company announcements or qualitative material. Simply Wall St has no position in any stocks mentioned.
Have feedback on this article? Concerned about the content? Get in touch with us directly. Alternatively, email editorial-team@simplywallst.com
About TSE:3141
Welcia Holdings
Operates a chain of drug stores with dispensing pharmacies in Japan.
Excellent balance sheet average dividend payer.
Similar Companies
Market Insights


Advertisement
Community Narratives
A case for TSXV:USA to reach USD $5.00 - $9.00 (CAD $7.30–$12.29) by 2029.
Fair Value CA$12.29|91.1% undervalued
AG
Community Contributor
DLocal's Future Growth Fueled by 35% Revenue and Profit Margin Boosts
Fair Value US$195.39|94.2% undervalued
WY
Community Contributor
Historically Cheap, but the Margin of Safety Is Still Thin
Fair Value SEK 232.58|13.2% undervalued
MA
Community Contributor