
Advertisement
- Japan
- /
- Food and Staples Retail
- /
- TSE:3088
MatsukiyoCocokara & Co. (TSE:3088) Stock Has Shown Weakness Lately But Financials Look Strong: Should Prospective Shareholders Make The Leap?
With its stock down 4.6% over the past three months, it is easy to disregard MatsukiyoCocokara (TSE:3088). But if you pay close attention, you might gather that its strong financials could mean that the stock could potentially see an increase in value in the long-term, given how markets usually reward companies with good financial health. In this article, we decided to focus on MatsukiyoCocokara's ROE.
Return on equity or ROE is an important factor to be considered by a shareholder because it tells them how effectively their capital is being reinvested. In simpler terms, it measures the profitability of a company in relation to shareholder's equity.
Check out our latest analysis for MatsukiyoCocokara
How Is ROE Calculated?
ROE can be calculated by using the formula:
Return on Equity = Net Profit (from continuing operations) ÷ Shareholders' Equity
So, based on the above formula, the ROE for MatsukiyoCocokara is:
10% = JP¥52b ÷ JP¥518b (Based on the trailing twelve months to June 2024).
The 'return' is the amount earned after tax over the last twelve months. Another way to think of that is that for every ¥1 worth of equity, the company was able to earn ¥0.10 in profit.
What Is The Relationship Between ROE And Earnings Growth?
So far, we've learned that ROE is a measure of a company's profitability. Depending on how much of these profits the company reinvests or "retains", and how effectively it does so, we are then able to assess a company’s earnings growth potential. Generally speaking, other things being equal, firms with a high return on equity and profit retention, have a higher growth rate than firms that don’t share these attributes.
A Side By Side comparison of MatsukiyoCocokara's Earnings Growth And 10% ROE
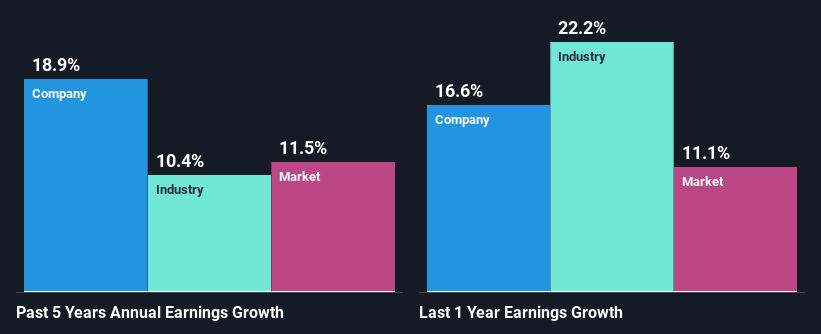
At first glance, MatsukiyoCocokara seems to have a decent ROE. Further, the company's ROE is similar to the industry average of 9.3%. Consequently, this likely laid the ground for the decent growth of 19% seen over the past five years by MatsukiyoCocokara.
We then compared MatsukiyoCocokara's net income growth with the industry and we're pleased to see that the company's growth figure is higher when compared with the industry which has a growth rate of 10% in the same 5-year period.
The basis for attaching value to a company is, to a great extent, tied to its earnings growth. It’s important for an investor to know whether the market has priced in the company's expected earnings growth (or decline). This then helps them determine if the stock is placed for a bright or bleak future. Has the market priced in the future outlook for 3088? You can find out in our latest intrinsic value infographic research report.
Is MatsukiyoCocokara Using Its Retained Earnings Effectively?
MatsukiyoCocokara's three-year median payout ratio to shareholders is 25% (implying that it retains 75% of its income), which is on the lower side, so it seems like the management is reinvesting profits heavily to grow its business.
Moreover, MatsukiyoCocokara is determined to keep sharing its profits with shareholders which we infer from its long history of paying a dividend for at least ten years.
Summary
On the whole, we feel that MatsukiyoCocokara's performance has been quite good. Particularly, we like that the company is reinvesting heavily into its business, and at a high rate of return. Unsurprisingly, this has led to an impressive earnings growth. Having said that, the company's earnings growth is expected to slow down, as forecasted in the current analyst estimates. Are these analysts expectations based on the broad expectations for the industry, or on the company's fundamentals? Click here to be taken to our analyst's forecasts page for the company.
New: Manage All Your Stock Portfolios in One Place
We've created the ultimate portfolio companion for stock investors, and it's free.
• Connect an unlimited number of Portfolios and see your total in one currency
• Be alerted to new Warning Signs or Risks via email or mobile
• Track the Fair Value of your stocks
Have feedback on this article? Concerned about the content? Get in touch with us directly. Alternatively, email editorial-team (at) simplywallst.com.
This article by Simply Wall St is general in nature. We provide commentary based on historical data and analyst forecasts only using an unbiased methodology and our articles are not intended to be financial advice. It does not constitute a recommendation to buy or sell any stock, and does not take account of your objectives, or your financial situation. We aim to bring you long-term focused analysis driven by fundamental data. Note that our analysis may not factor in the latest price-sensitive company announcements or qualitative material. Simply Wall St has no position in any stocks mentioned.
About TSE:3088
MatsukiyoCocokara
Operates and manages chain stores, drug stores and insurance dispensing pharmacies in Japan.
Flawless balance sheet, good value and pays a dividend.
Similar Companies
Market Insights

Advertisement
Community Narratives
Kodiak AI - a potential 100 bagger opportunity?
Fair Value US$14.00|44.7% undervalued
DA
Community Contributor
A Fair Price for a Great Business Facing Real Threats
Fair Value US$383.06|10.4% undervalued
IM
Community Contributor
AXON And Shopify Integration Will Unlock Global Mobile Advertising
Fair Value US$646.30|12.4% undervalued
AN
Based on Analyst Price Targets