
Advertisement
Will Weakness in Mizuno Corporation's (TSE:8022) Stock Prove Temporary Given Strong Fundamentals?
Mizuno (TSE:8022) has had a rough month with its share price down 9.8%. But if you pay close attention, you might gather that its strong financials could mean that the stock could potentially see an increase in value in the long-term, given how markets usually reward companies with good financial health. Particularly, we will be paying attention to Mizuno's ROE today.
ROE or return on equity is a useful tool to assess how effectively a company can generate returns on the investment it received from its shareholders. In other words, it is a profitability ratio which measures the rate of return on the capital provided by the company's shareholders.
View our latest analysis for Mizuno
How Is ROE Calculated?
Return on equity can be calculated by using the formula:
Return on Equity = Net Profit (from continuing operations) ÷ Shareholders' Equity
So, based on the above formula, the ROE for Mizuno is:
10% = JP¥15b ÷ JP¥148b (Based on the trailing twelve months to June 2024).
The 'return' is the yearly profit. One way to conceptualize this is that for each ¥1 of shareholders' capital it has, the company made ¥0.10 in profit.
Why Is ROE Important For Earnings Growth?
So far, we've learned that ROE is a measure of a company's profitability. Depending on how much of these profits the company reinvests or "retains", and how effectively it does so, we are then able to assess a company’s earnings growth potential. Assuming everything else remains unchanged, the higher the ROE and profit retention, the higher the growth rate of a company compared to companies that don't necessarily bear these characteristics.
Mizuno's Earnings Growth And 10% ROE
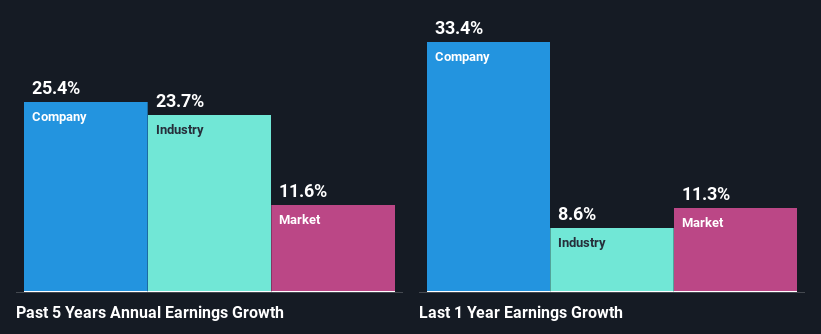
To start with, Mizuno's ROE looks acceptable. Further, the company's ROE is similar to the industry average of 10%. This probably goes some way in explaining Mizuno's significant 25% net income growth over the past five years amongst other factors. However, there could also be other drivers behind this growth. For instance, the company has a low payout ratio or is being managed efficiently.
Next, on comparing Mizuno's net income growth with the industry, we found that the company's reported growth is similar to the industry average growth rate of 24% over the last few years.
Earnings growth is an important metric to consider when valuing a stock. The investor should try to establish if the expected growth or decline in earnings, whichever the case may be, is priced in. By doing so, they will have an idea if the stock is headed into clear blue waters or if swampy waters await. What is 8022 worth today? The intrinsic value infographic in our free research report helps visualize whether 8022 is currently mispriced by the market.
Is Mizuno Efficiently Re-investing Its Profits?
Mizuno has a really low three-year median payout ratio of 18%, meaning that it has the remaining 82% left over to reinvest into its business. So it looks like Mizuno is reinvesting profits heavily to grow its business, which shows in its earnings growth.
Besides, Mizuno has been paying dividends for at least ten years or more. This shows that the company is committed to sharing profits with its shareholders.
Summary
Overall, we are quite pleased with Mizuno's performance. In particular, it's great to see that the company is investing heavily into its business and along with a high rate of return, that has resulted in a sizeable growth in its earnings. With that said, the latest industry analyst forecasts reveal that the company's earnings growth is expected to slow down. Are these analysts expectations based on the broad expectations for the industry, or on the company's fundamentals? Click here to be taken to our analyst's forecasts page for the company.
New: Manage All Your Stock Portfolios in One Place
We've created the ultimate portfolio companion for stock investors, and it's free.
• Connect an unlimited number of Portfolios and see your total in one currency
• Be alerted to new Warning Signs or Risks via email or mobile
• Track the Fair Value of your stocks
Have feedback on this article? Concerned about the content? Get in touch with us directly. Alternatively, email editorial-team (at) simplywallst.com.
This article by Simply Wall St is general in nature. We provide commentary based on historical data and analyst forecasts only using an unbiased methodology and our articles are not intended to be financial advice. It does not constitute a recommendation to buy or sell any stock, and does not take account of your objectives, or your financial situation. We aim to bring you long-term focused analysis driven by fundamental data. Note that our analysis may not factor in the latest price-sensitive company announcements or qualitative material. Simply Wall St has no position in any stocks mentioned.
About TSE:8022
Mizuno
Manufactures and sells sports products in Japan, the rest of Asia, Europe, the Americas, and Oceania.
Flawless balance sheet and undervalued.
Similar Companies
Market Insights

Advertisement
Community Narratives
Finding The True Value Of A Logistics Powerhouse
Fair Value US$95.21|8.5% undervalued
NV
Community Contributor
Paradigm Biopharmaceuticals Will Lead Osteoarthritis Treatment with Zilosul's FDA Success
Fair Value AU$5.50|91.8% undervalued
AM
Community Contributor
Barrick Mining (ABX:CA): A Gold Hedge against a U.S. Shutdown
Fair Value CA$60.00|26.5% undervalued
GM
Community Contributor