Advertisement
ASICS (TSE:7936): Assessing Valuation After Strong Share Price Momentum

Simply Wall St
Reviewed by Simply Wall St
ASICS (TSE:7936) is drawing investor attention following its recent share price movement. The company’s performance over the past month and quarter hints at shifting market sentiment. This encourages a closer look at what might be driving this activity.
See our latest analysis for ASICS.
ASICS’ impressive year-to-date share price return of 30.27% reflects building momentum, with a steep 51.97% total shareholder return over the last 12 months underscoring steadily rising optimism for the brand. Recent gains suggest that investors are warming to the company’s prospects and growth story in the consumer durables space, even as the competitive landscape remains dynamic.
If strong momentum in ASICS has piqued your curiosity about what else is breaking out, this is a great opportunity to discover fast growing stocks with high insider ownership
But with shares up more than 50% over the past year and ASICS trading close to analyst targets, the big question now is whether the stock still offers value for new investors or if future growth is already reflected in the price.
Price-to-Earnings of 38x: Is it justified?
ASICS is currently trading at a price-to-earnings (P/E) ratio of 38x, which is significantly higher than its peers and the broader industry. At the last close of ¥3985, the stock appears expensive relative to Japanese luxury peers, especially as analyst targets are not far above current levels.
The P/E ratio measures how much investors are willing to pay for each yen of earnings. In consumer durables, a high P/E typically reflects robust growth expectations and confidence in sustained profitability.
With a multiple well above the industry average of 13.4x and a fair price-to-earnings estimate of 23.1x, the market is clearly pricing in more optimism for ASICS than for its rivals. This premium suggests investors expect outperformance driven by recent momentum. However, it also leaves less room for upside if growth falls short. The fair ratio implies a level the market could revert to if sentiment normalizes.
Explore the SWS fair ratio for ASICS
Result: Price-to-Earnings of 38x (OVERVALUED)
However, slowing revenue growth or a sudden shift in market sentiment could quickly dampen ASICS’ upward momentum and put pressure on its premium valuation.
Find out about the key risks to this ASICS narrative.
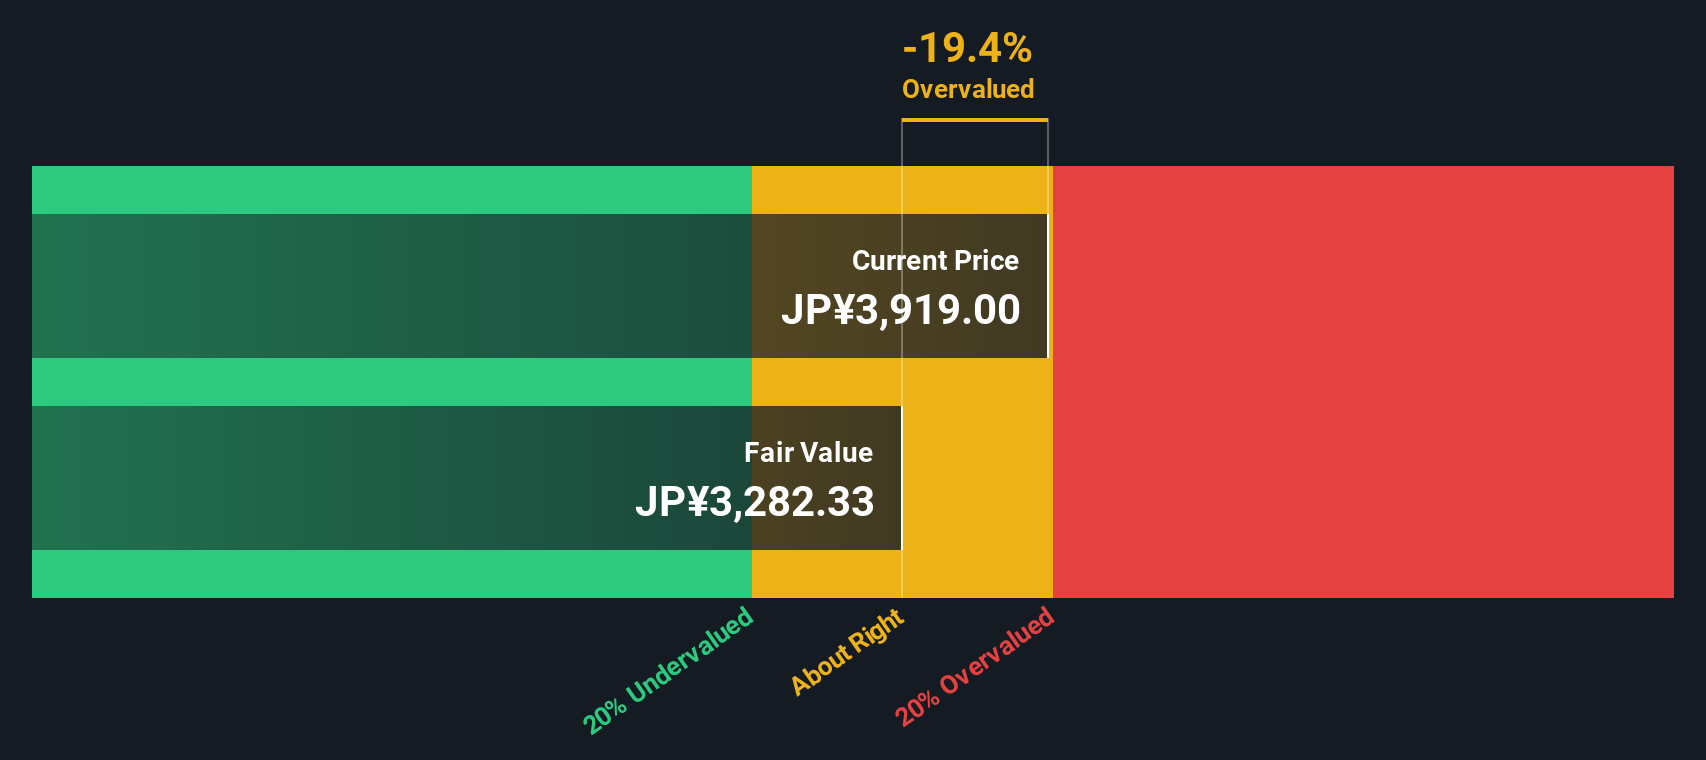
Another View: Discounted Cash Flow Perspective
Looking at ASICS through the lens of our SWS DCF model, a different story appears. The DCF suggests the stock price is a fair distance above what fundamental cash flows imply. This could mean that optimism may be running ahead of the numbers. Does this put expectations at risk?
Look into how the SWS DCF model arrives at its fair value.
Simply Wall St performs a discounted cash flow (DCF) on every stock in the world every day (check out ASICS for example). We show the entire calculation in full. You can track the result in your watchlist or portfolio and be alerted when this changes, or use our stock screener to discover undervalued stocks based on their cash flows. If you save a screener we even alert you when new companies match - so you never miss a potential opportunity.
Build Your Own ASICS Narrative
If you have your own perspective or prefer hands-on analysis, you can craft a personal view in just minutes. Do it your way
A great starting point for your ASICS research is our analysis highlighting 2 key rewards and 1 important warning sign that could impact your investment decision.
Looking for More Exciting Investment Opportunities?
Real opportunities are waiting beyond ASICS, and these handpicked stock ideas could be your next smart move. Don’t let great investments slip by. Start searching now.
- Unlock market-beating yield by targeting income potential through these 17 dividend stocks with yields > 3% that offer robust returns above 3%.
- Catalyze your portfolio’s growth by jumping into these 27 AI penny stocks primed for breakthroughs in artificial intelligence.
- Position yourself for the future of computing with these 27 quantum computing stocks before everyone else catches on.
This article by Simply Wall St is general in nature. We provide commentary based on historical data and analyst forecasts only using an unbiased methodology and our articles are not intended to be financial advice. It does not constitute a recommendation to buy or sell any stock, and does not take account of your objectives, or your financial situation. We aim to bring you long-term focused analysis driven by fundamental data. Note that our analysis may not factor in the latest price-sensitive company announcements or qualitative material. Simply Wall St has no position in any stocks mentioned.
New: Manage All Your Stock Portfolios in One Place
We've created the ultimate portfolio companion for stock investors, and it's free.
• Connect an unlimited number of Portfolios and see your total in one currency
• Be alerted to new Warning Signs or Risks via email or mobile
• Track the Fair Value of your stocks
Have feedback on this article? Concerned about the content? Get in touch with us directly. Alternatively, email editorial-team@simplywallst.com
About TSE:7936
ASICS
Manufactures and sells sporting goods in Japan and internationally.
Flawless balance sheet with solid track record.
Similar Companies
Market Insights

Advertisement
Community Narratives
Finding The True Value Of A Logistics Powerhouse
Fair Value US$95.21|8.6% undervalued
NV
Community Contributor
Paradigm Biopharmaceuticals Will Lead Osteoarthritis Treatment with Zilosul's FDA Success
Fair Value AU$5.50|92.1% undervalued
AM
Community Contributor
Barrick Mining (ABX:CA): A Gold Hedge against a U.S. Shutdown
Fair Value CA$60.00|25.6% undervalued
GM
Community Contributor