
Advertisement
If you have been keeping an eye on YONEX, you are not alone. After all, in a year that has seen many stocks simply treading water, YONEX has delivered jaw-dropping returns. The stock is up 83.7% since January and an incredible 584.8% over the last five years. Even just this past week, it edged up another 2.0%, showing that investor interest is still running hot. On the flip side, it did slip a touch over the last 30 days, but considering its tremendous long-term run, most shareholders are still sitting on big gains.
Much of this momentum seems to reflect growing optimism about the company's outlook. There has not been a single major announcement that singlehandedly caused the surge, but rather a steady build-up of confidence in YONEX’s market positioning and product demand, particularly as global interest in sports and wellness continues to climb. Risk appetite among investors has clearly increased as well, pointing to a company that could be seen as a growth leader in its segment.
Now, with prices at these levels, the real question is whether YONEX is actually undervalued or if the stock has simply run too far ahead of itself. Interestingly, by a conventional valuation scorecard, where a company gets a point for each of six tests of being undervalued, YONEX scores a 0. That means, by these metrics, it is not considered undervalued by any of the standard tests.
Let us unpack what goes into these valuation approaches to see what this really means for investors. At the end, I will share a perspective that goes beyond the usual checklists for a more nuanced take on whether YONEX is worth your attention now.
YONEX scores just 0/6 on our valuation checks. See what other red flags we found in the full valuation breakdown.
Approach 1: YONEX Discounted Cash Flow (DCF) Analysis
The Discounted Cash Flow (DCF) model estimates a company's intrinsic value by projecting its future cash flows and discounting them back to today's value. This method aims to determine what those future cash streams are worth in today's money, using both analyst estimates and broader long-term projections.
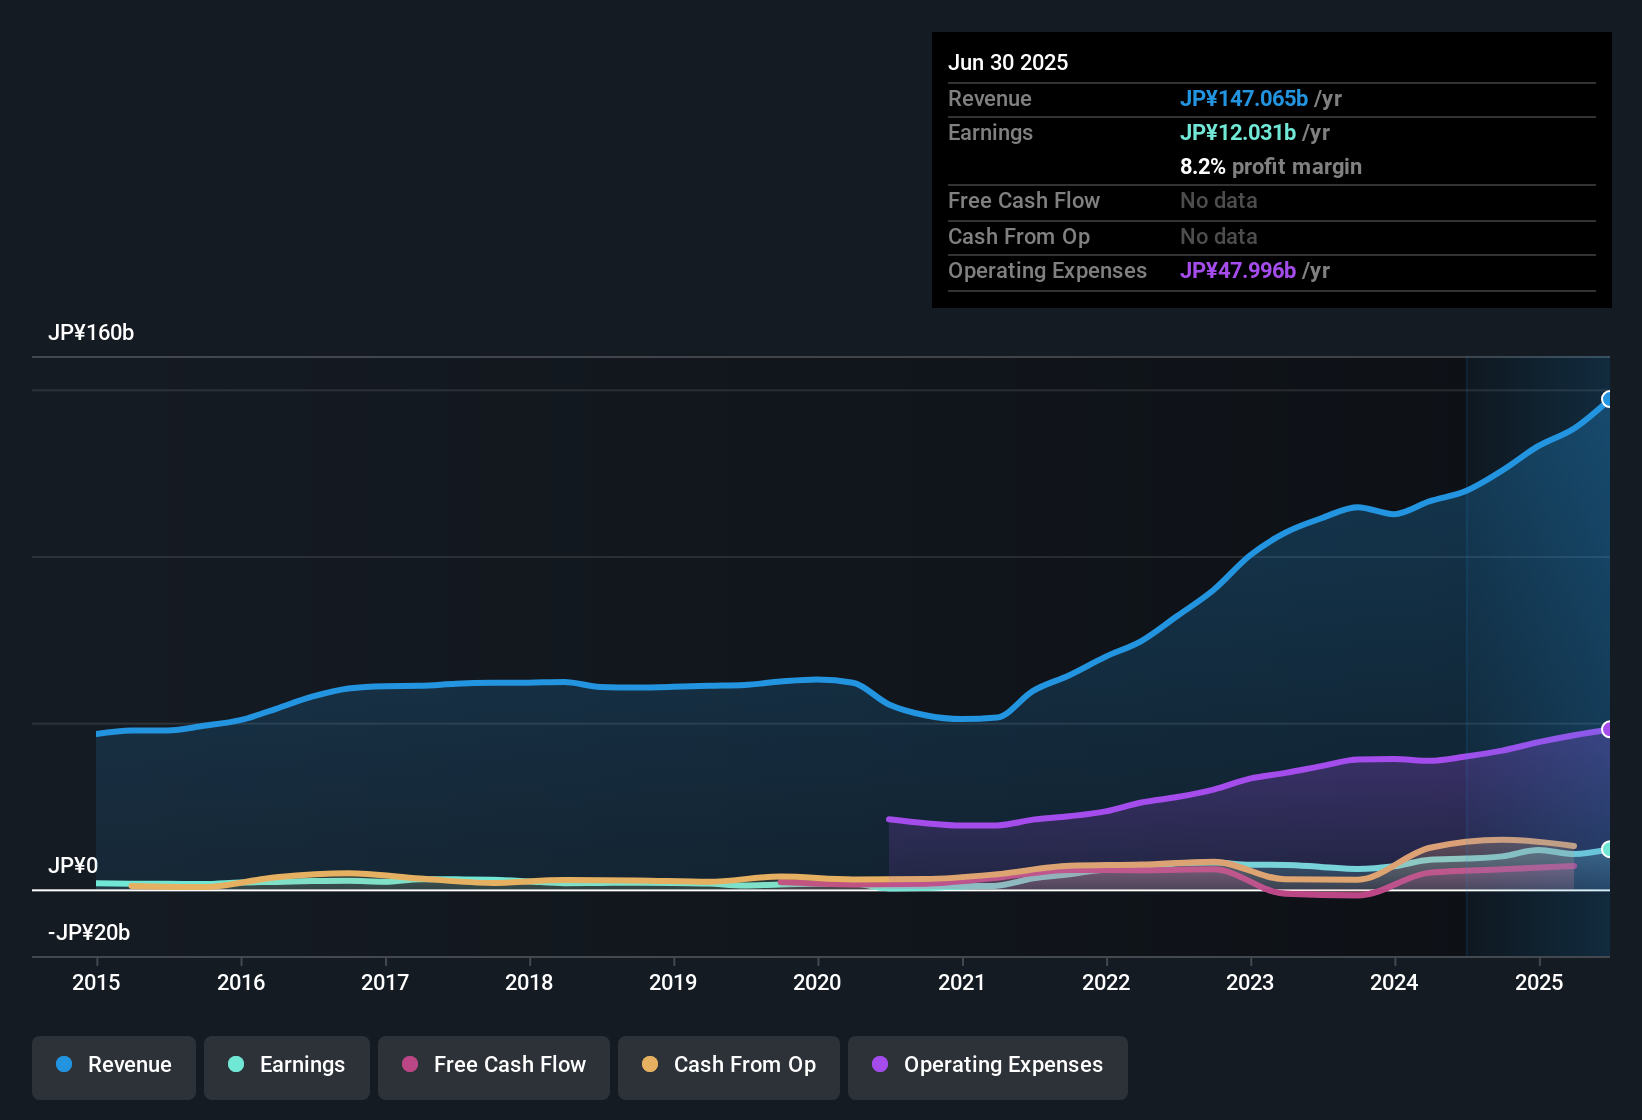
According to the latest DCF analysis for YONEX, the company reported a last twelve months Free Cash Flow (FCF) of ¥6,481.7 Million. Analyst projections forecast steady growth, with FCF expected to reach ¥13,788 Million by 2030. Since analysts only provide up to five years of estimates, numbers beyond this are extrapolated using standard growth rates. The underlying model in this analysis is the 2 Stage Free Cash Flow to Equity approach, which accounts for different growth rates in early and later years to build a balanced long-term picture.
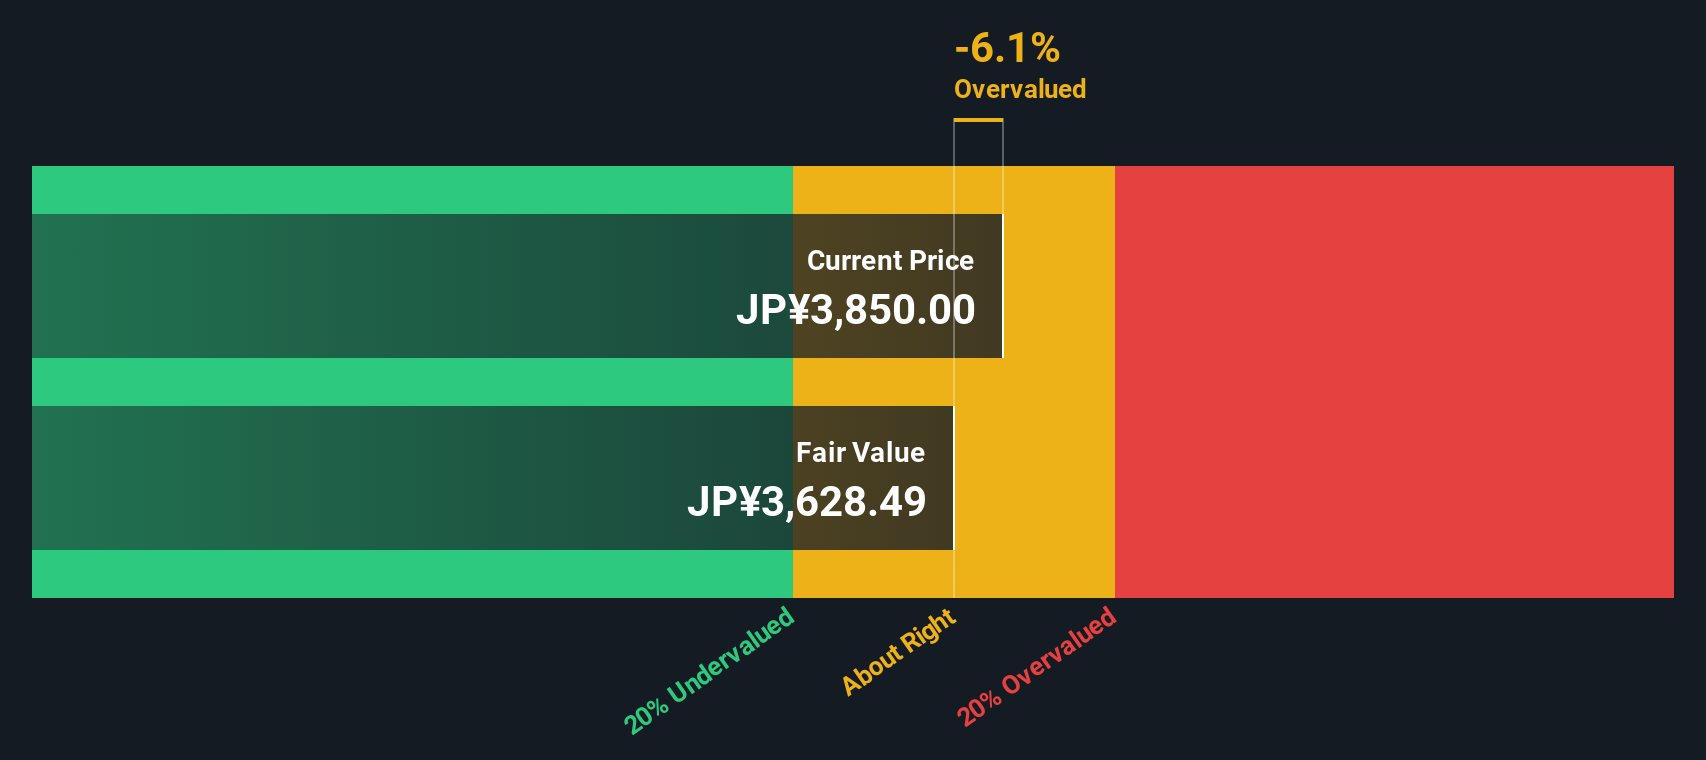
The estimated intrinsic value for YONEX using the DCF model is ¥3,582 per share. When compared to the current stock price, YONEX trades at a 9.4% premium, meaning it is slightly overvalued by this metric. For investors, this suggests that enthusiasm has pushed the stock just above what the cash flow fundamentals support.
Result: ABOUT RIGHT
Simply Wall St performs a valuation analysis on every stock in the world every day (check out YONEX's valuation analysis). We show the entire calculation in full. You can track the result in your watchlist or portfolio and be alerted when this changes.
Approach 2: YONEX Price vs Earnings (PE)
The price-to-earnings (PE) ratio is a time-tested tool for valuing profitable companies like YONEX, as it gauges how much investors are willing to pay today for each unit of current earnings. Since YONEX is generating healthy profits, the PE ratio provides a clear lens for how the market values its earnings power.
It's important to remember that a “normal” or “fair” PE ratio depends not just on profits, but also on expectations for future growth, the riskiness of those profits, and the industry the company is in. Companies with higher growth prospects and more stable earnings often deserve a higher PE multiple, whereas riskier, slower-growing firms typically trade at lower levels.
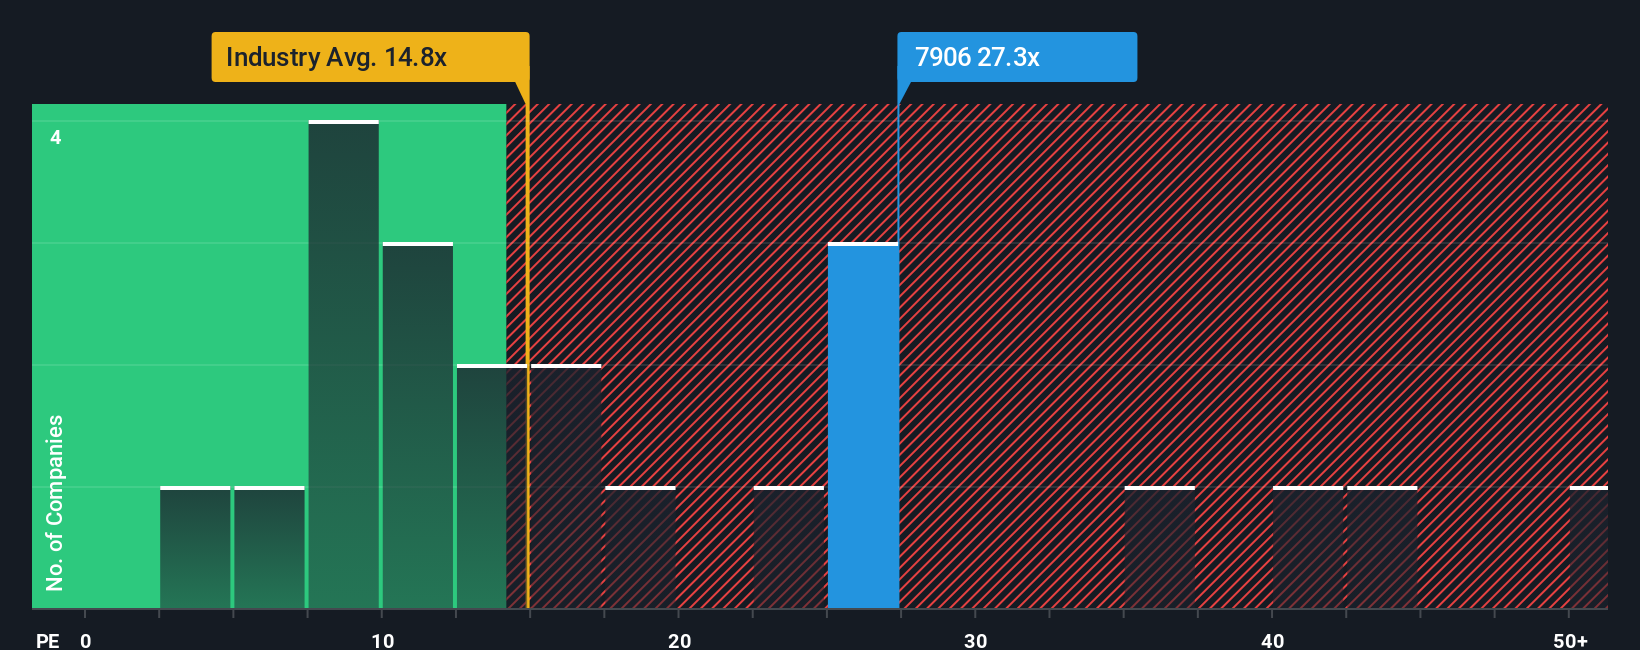
Currently, YONEX trades at 27.8x earnings, which stands well ahead of both the leisure industry average of 15.0x and its peer average of 13.9x. At first glance, this might signal that YONEX is expensive relative to its competitors. However, Simply Wall St's proprietary “Fair Ratio” goes a step further. This Fair Ratio, calculated by factoring in YONEX's growth, profit margin, market cap, industry conditions, and specific risks, lands at 17.9x. Unlike blunt comparisons to peers or industry averages, the Fair Ratio delivers a nuanced benchmark reflecting what a reasonable investor might expect to pay for a company with YONEX's profile.
Comparing this Fair Ratio of 17.9x to YONEX's current 27.8x PE, the stock trades at a notable premium to what Simply Wall St considers a fair valuation for its fundamentals. This suggests the market’s enthusiasm for YONEX is running somewhat ahead of its underlying earnings power.
Result: OVERVALUED
PE ratios tell one story, but what if the real opportunity lies elsewhere? Discover companies where insiders are betting big on explosive growth.
Upgrade Your Decision Making: Choose your YONEX Narrative
Earlier we mentioned that there’s an even better way to understand valuation, so let’s introduce you to Narratives. In simple terms, a Narrative is your own story about a company, the reasoning and expectations you have for its future, translated into forecasts like revenue, profit margins, and fair value. Narratives go beyond the raw numbers, connecting your view of YONEX’s market position and growth prospects directly to what you think the shares are really worth.
On Simply Wall St's Community page, millions of investors already use Narratives as an easy, interactive tool for smarter investing. Narratives empower you to compare your estimated fair value to the current price, helping you decide whether it’s time to buy, sell, or hold. Best of all, Narratives automatically update when new financial results or news are released, so you’re always investing based on the latest information.
For example, some investors may believe YONEX is set for continued growth and assign a much higher fair value, while others, more cautious about demand, see a lower fair value based on their Narrative.
Do you think there's more to the story for YONEX? Create your own Narrative to let the Community know!
This article by Simply Wall St is general in nature. We provide commentary based on historical data and analyst forecasts only using an unbiased methodology and our articles are not intended to be financial advice. It does not constitute a recommendation to buy or sell any stock, and does not take account of your objectives, or your financial situation. We aim to bring you long-term focused analysis driven by fundamental data. Note that our analysis may not factor in the latest price-sensitive company announcements or qualitative material. Simply Wall St has no position in any stocks mentioned.
New: Manage All Your Stock Portfolios in One Place
We've created the ultimate portfolio companion for stock investors, and it's free.
• Connect an unlimited number of Portfolios and see your total in one currency
• Be alerted to new Warning Signs or Risks via email or mobile
• Track the Fair Value of your stocks
Have feedback on this article? Concerned about the content? Get in touch with us directly. Alternatively, email editorial-team@simplywallst.com
About TSE:7906
Excellent balance sheet with proven track record.
Similar Companies
Market Insights

Advertisement
Community Narratives
The Next Phase of Energy Storage: How NeoVolta Is Tackling America’s Power Crunch
Fair Value US$7.50|35.1% undervalued
MA
Community Contributor
Why EnSilica is Worth Possibly 13x its Current Price
Fair Value UK£5.00|89.8% undervalued
DO
Community Contributor
M&A Activity, Industry Diversification & A Defense Contract Monopoly Will Push BWXT For Healthy Long-Term Growth
Fair Value US$220.00|15.2% undervalued
CL
Community Contributor
A case for Cassiar Gold Corp (TSXV: GLDC) to reach CAD$8-10 before 2030 (X30-37)
Fair Value CA$10.00|96.0% undervalued
AG
Community Contributor