- Japan
- /
- Consumer Durables
- /
- TSE:6753
Does Sharp’s Turnaround Effort Make Sense After a 22% Share Price Slide?

Reviewed by Bailey Pemberton
- Wondering if Sharp is a bargain or a value trap at today’s price? You are not alone. This piece unpacks what the current market is really implying about the stock.
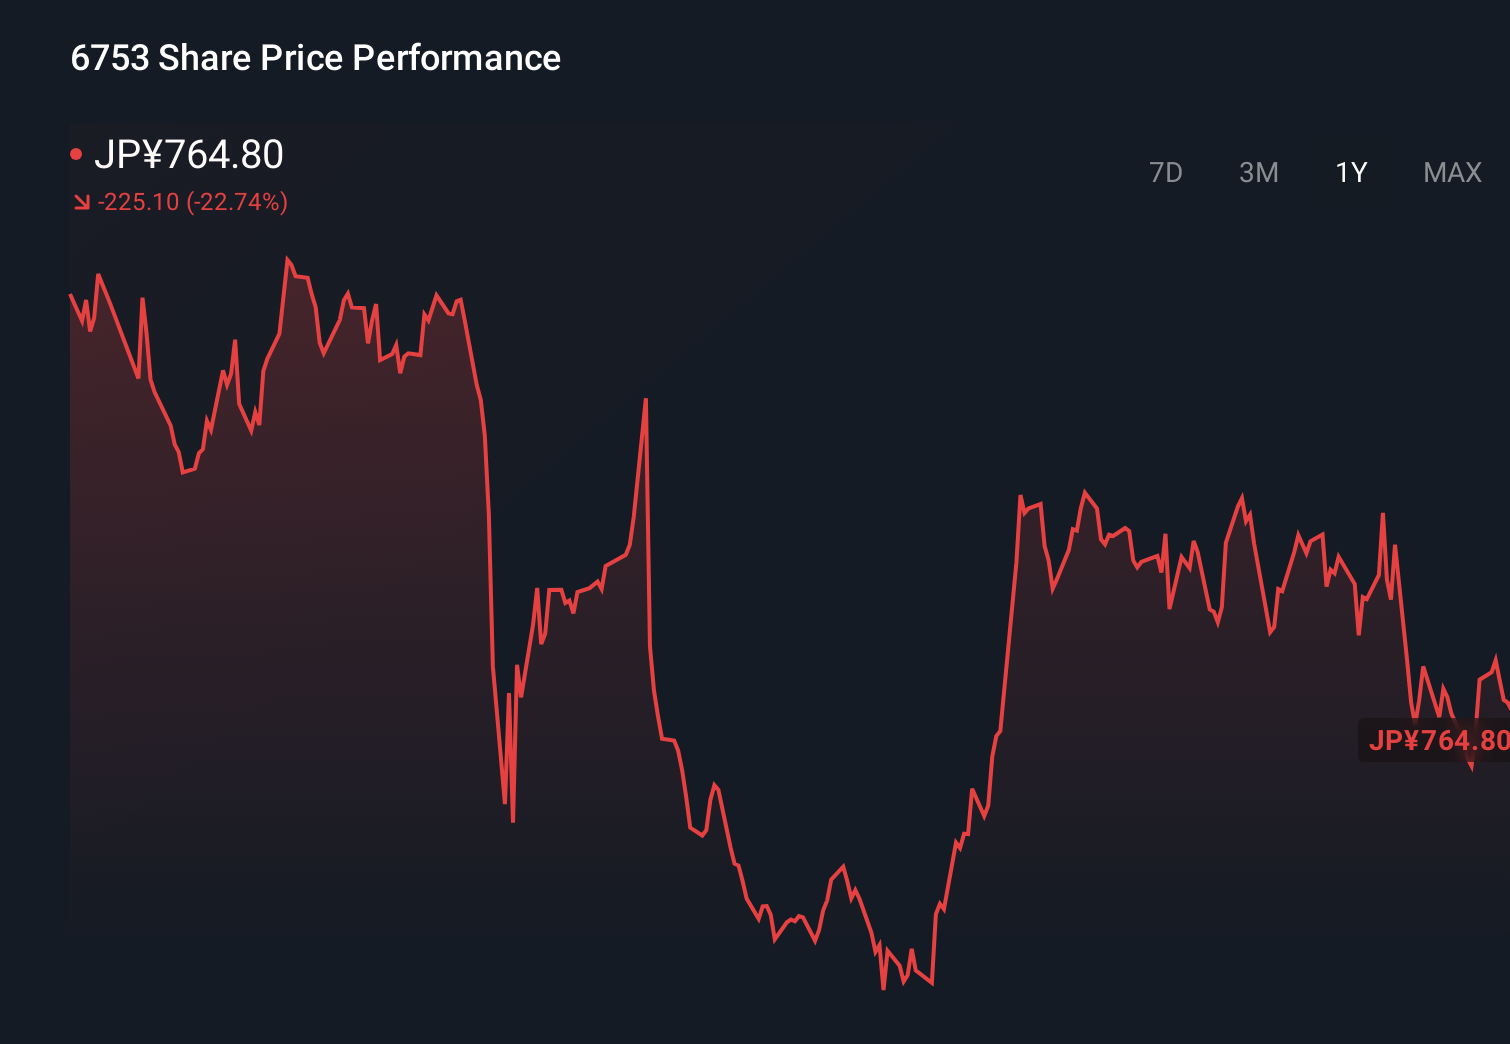
- Despite trading around ¥772, Sharp is down 1.7% over the last week, 1.5% over the last month, and 22.2% over the past year. That backdrop may be interesting for investors who focus on beaten down stories with potential for a turnaround.
- Recent headlines have focused on Sharp’s ongoing restructuring efforts and strategic partnerships in displays and electronics, signaling a push to stabilize operations and refocus on higher value segments. At the same time, concerns about competition and softer demand in key product lines have kept sentiment cautious, which helps explain why the share price has struggled to gain traction.
- On our checks, Sharp currently posts a valuation score of 3/6, suggesting pockets of undervaluation but not a clear-cut case. Next, we break down what different valuation approaches say about that score, before finishing with a more holistic way to think about Sharp’s overall value.
Find out why Sharp's -22.2% return over the last year is lagging behind its peers.
Approach 1: Sharp Discounted Cash Flow (DCF) Analysis
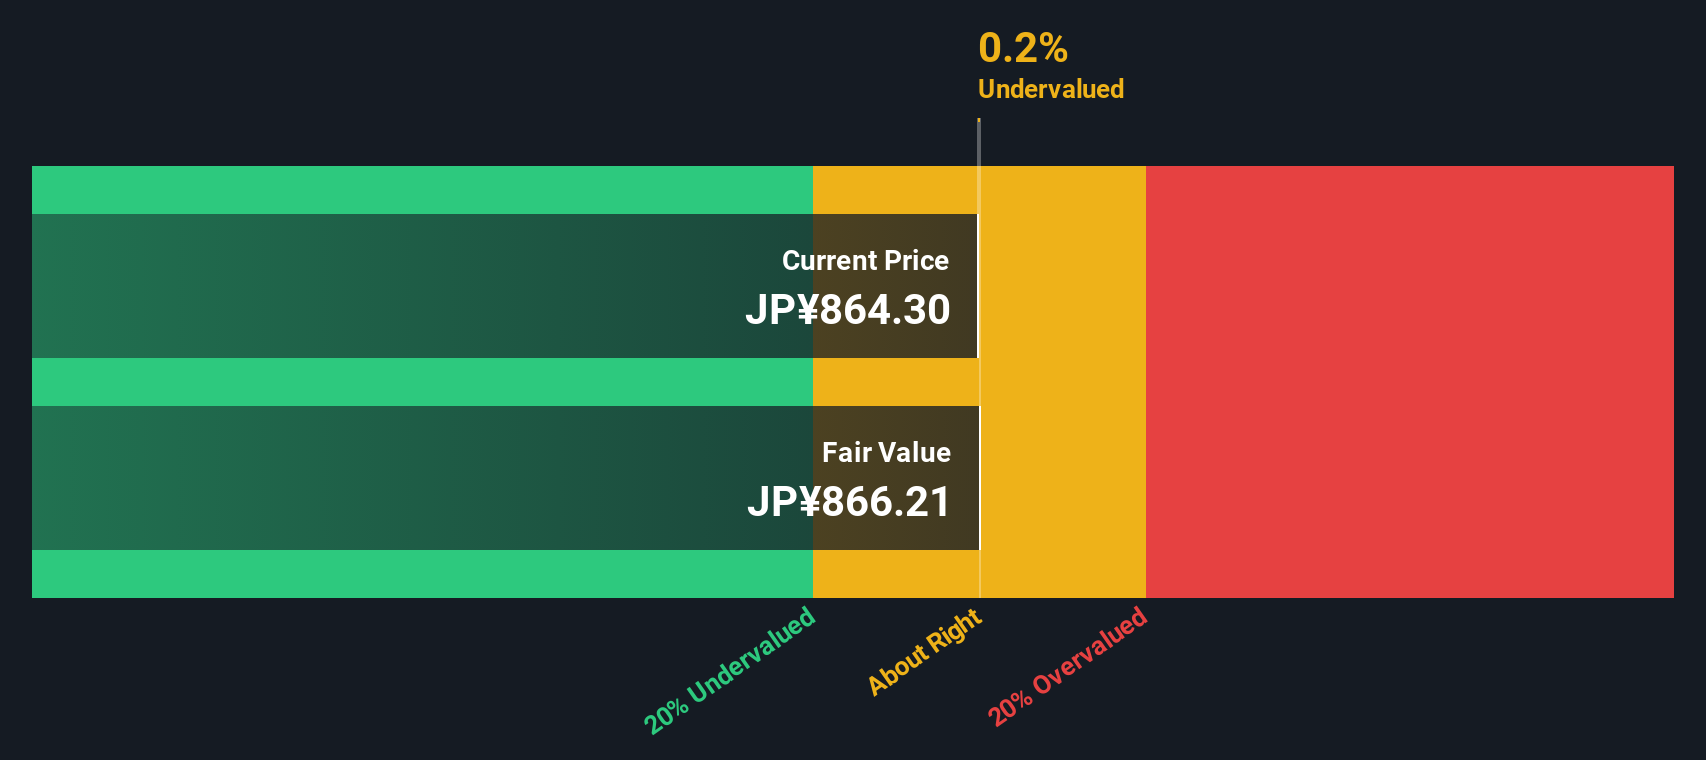
A Discounted Cash Flow model estimates what a company is worth by projecting its future cash flows and then discounting them back to today, using a required rate of return. For Sharp, this 2 stage Free Cash Flow to Equity model starts from today’s negative free cash flow of roughly ¥51.8 billion, reflecting ongoing restructuring and pressure on profitability.
Analysts expect a strong rebound, with projected free cash flow of about ¥103.9 billion in 2026 and around ¥36.6 billion by 2030. Estimates beyond the near term are extrapolated, rather than directly forecast by analysts, so the further out we go, the more cautious we should be about precision. Aggregating and discounting these projected ¥ cash flows gives an estimated intrinsic value of roughly ¥708 per share.
With the stock trading near ¥772, the DCF implies Sharp is about 9.0% overvalued at current levels. On this view, the market is already pricing in much of the anticipated turnaround.
Result: ABOUT RIGHT
Sharp is fairly valued according to our Discounted Cash Flow (DCF), but this can change at a moment's notice. Track the value in your watchlist or portfolio and be alerted on when to act.
Approach 2: Sharp Price vs Earnings
For profitable companies like Sharp, the price to earnings (PE) ratio is a useful shorthand for how much investors are willing to pay for each unit of current earnings. It naturally captures the trade off between today’s profitability and expectations for future growth, while also reflecting perceived risk.
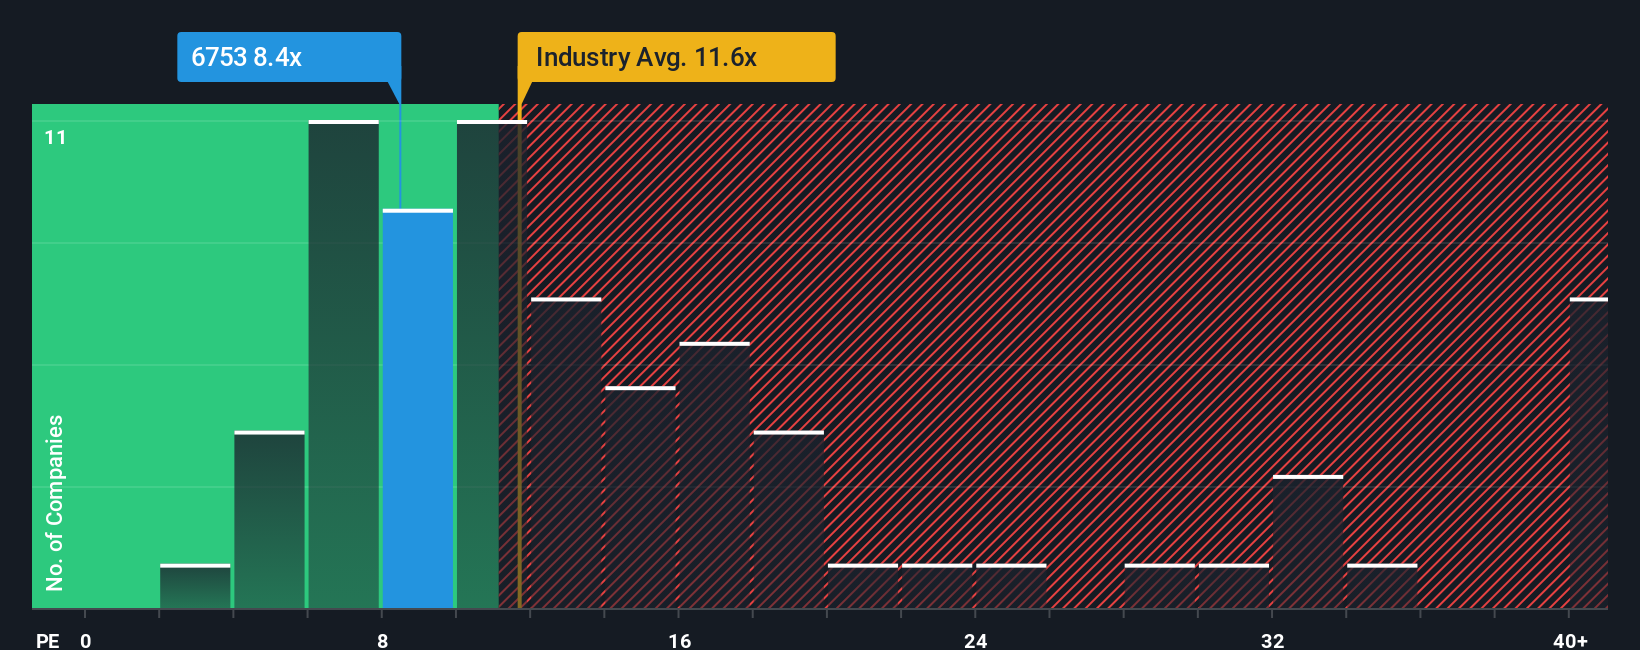
In general, faster and more predictable earnings growth can justify a higher PE, while cyclical or riskier businesses tend to trade on lower multiples. Sharp currently trades on about 8.6x earnings, which is below both the Consumer Durables industry average of roughly 11.6x and the broader peer group average of about 28.1x, suggesting the market is applying a noticeable discount.
Simply Wall St’s Fair Ratio framework goes a step further by estimating what PE Sharp might trade on given its growth outlook, profit margins, size, risk profile and industry, rather than relying only on simple peer comparisons. For Sharp, that Fair Ratio is around 13.1x, indicating the shares appear undervalued relative to what its fundamentals would typically warrant.
Result: UNDERVALUED
PE ratios tell one story, but what if the real opportunity lies elsewhere? Discover 1456 companies where insiders are betting big on explosive growth.
Upgrade Your Decision Making: Choose your Sharp Narrative
Earlier we mentioned that there is an even better way to understand valuation, so let us introduce you to Narratives, a simple way to connect your view of Sharp’s story with the numbers behind it. A Narrative is your own investment story for the company, where you set assumptions for future revenue, earnings and margins, which then flow into a financial forecast and ultimately into an estimated fair value. On Simply Wall St’s Community page, used by millions of investors, Narratives make this process accessible, guiding you from “what I believe about Sharp’s future” to “what that belief implies the stock is worth” and how that compares to today’s share price. This comparison between Fair Value and current Price can help you decide how Sharp aligns with your story as an investor. Narratives also update dynamically when new information, like earnings or major news, is released, so your fair value view can evolve as the facts change. For example, one Narrative might assume a sharp recovery in display demand and assign a much higher fair value than another Narrative that assumes weaker pricing and more modest margins.
Do you think there's more to the story for Sharp? Head over to our Community to see what others are saying!
This article by Simply Wall St is general in nature. We provide commentary based on historical data and analyst forecasts only using an unbiased methodology and our articles are not intended to be financial advice. It does not constitute a recommendation to buy or sell any stock, and does not take account of your objectives, or your financial situation. We aim to bring you long-term focused analysis driven by fundamental data. Note that our analysis may not factor in the latest price-sensitive company announcements or qualitative material. Simply Wall St has no position in any stocks mentioned.
The New Payments ETF Is Live on NASDAQ:
Money is moving to real-time rails, and a newly listed ETF now gives investors direct exposure. Fast settlement. Institutional custody. Simple access.
Explore how this launch could reshape portfolios
Sponsored ContentNew: Manage All Your Stock Portfolios in One Place
We've created the ultimate portfolio companion for stock investors, and it's free.
• Connect an unlimited number of Portfolios and see your total in one currency
• Be alerted to new Warning Signs or Risks via email or mobile
• Track the Fair Value of your stocks
Have feedback on this article? Concerned about the content? Get in touch with us directly. Alternatively, email editorial-team@simplywallst.com
About TSE:6753
Sharp
Manufactures and sells telecommunication equipment, electric and electronic application equipment, and electronic components in Japan, the United States, China, rest of Asia, and internationally.
Fair value with mediocre balance sheet.
Similar Companies
Market Insights


Weekly Picks

Early mover in a fast growing industry. Likely to experience share price volatility as they scale


A case for CA$31.80 (undiluted), aka 8,616% upside from CA$0.37 (an 86 bagger!).


Moderation and Stabilisation: HOLD: Fair Price based on a 4-year Cycle is $12.08
Recently Updated Narratives


Title: Market Sentiment Is Dead Wrong — Here's Why PSEC Deserves a Second Look


An amazing opportunity to potentially get a 100 bagger

Amazon: Why the World’s Biggest Platform Still Runs on Invisible Economics
Popular Narratives


Crazy Undervalued 42 Baggers Silver Play (Active & Running Mine)


MicroVision will explode future revenue by 380.37% with a vision towards success


NVDA: Expanding AI Demand Will Drive Major Data Center Investments Through 2026
Trending Discussion
