
Advertisement
David Iben put it well when he said, 'Volatility is not a risk we care about. What we care about is avoiding the permanent loss of capital.' When we think about how risky a company is, we always like to look at its use of debt, since debt overload can lead to ruin. Importantly, Open House Group Co., Ltd. (TSE:3288) does carry debt. But the real question is whether this debt is making the company risky.
What Risk Does Debt Bring?
Generally speaking, debt only becomes a real problem when a company can't easily pay it off, either by raising capital or with its own cash flow. If things get really bad, the lenders can take control of the business. However, a more common (but still painful) scenario is that it has to raise new equity capital at a low price, thus permanently diluting shareholders. Of course, the upside of debt is that it often represents cheap capital, especially when it replaces dilution in a company with the ability to reinvest at high rates of return. When we think about a company's use of debt, we first look at cash and debt together.
What Is Open House Group's Net Debt?
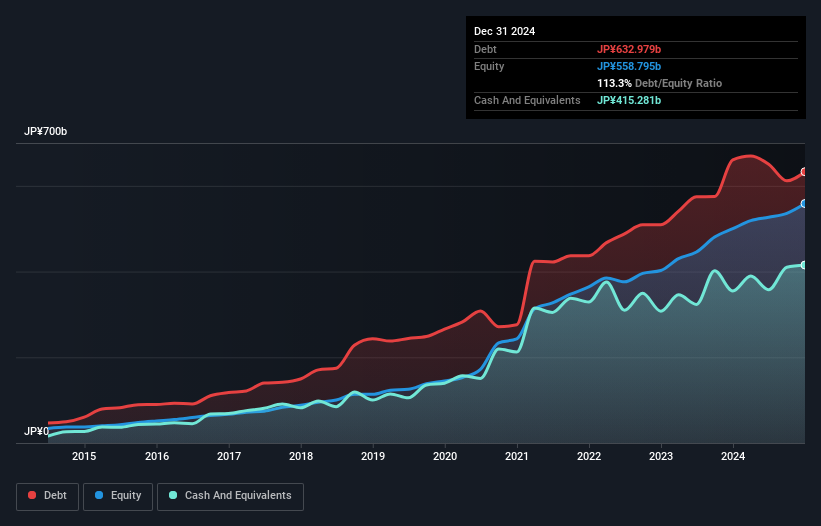
As you can see below, Open House Group had JP¥633.0b of debt at December 2024, down from JP¥660.5b a year prior. However, it does have JP¥415.3b in cash offsetting this, leading to net debt of about JP¥217.7b.
How Healthy Is Open House Group's Balance Sheet?
We can see from the most recent balance sheet that Open House Group had liabilities of JP¥337.6b falling due within a year, and liabilities of JP¥420.6b due beyond that. Offsetting these obligations, it had cash of JP¥415.3b as well as receivables valued at JP¥94.6b due within 12 months. So its liabilities outweigh the sum of its cash and (near-term) receivables by JP¥248.3b.
Open House Group has a market capitalization of JP¥704.5b, so it could very likely raise cash to ameliorate its balance sheet, if the need arose. But it's clear that we should definitely closely examine whether it can manage its debt without dilution.
See our latest analysis for Open House Group
We use two main ratios to inform us about debt levels relative to earnings. The first is net debt divided by earnings before interest, tax, depreciation, and amortization (EBITDA), while the second is how many times its earnings before interest and tax (EBIT) covers its interest expense (or its interest cover, for short). Thus we consider debt relative to earnings both with and without depreciation and amortization expenses.
Open House Group's net debt to EBITDA ratio of about 1.8 suggests only moderate use of debt. And its commanding EBIT of 35.9 times its interest expense, implies the debt load is as light as a peacock feather. The bad news is that Open House Group saw its EBIT decline by 16% over the last year. If that sort of decline is not arrested, then the managing its debt will be harder than selling broccoli flavoured ice-cream for a premium. The balance sheet is clearly the area to focus on when you are analysing debt. But ultimately the future profitability of the business will decide if Open House Group can strengthen its balance sheet over time. So if you're focused on the future you can check out this free report showing analyst profit forecasts.
Finally, a company can only pay off debt with cold hard cash, not accounting profits. So it's worth checking how much of that EBIT is backed by free cash flow. Looking at the most recent three years, Open House Group recorded free cash flow of 22% of its EBIT, which is weaker than we'd expect. That's not great, when it comes to paying down debt.
Our View
Open House Group's EBIT growth rate and conversion of EBIT to free cash flow definitely weigh on it, in our esteem. But the good news is it seems to be able to cover its interest expense with its EBIT with ease. Taking the abovementioned factors together we do think Open House Group's debt poses some risks to the business. While that debt can boost returns, we think the company has enough leverage now. Above most other metrics, we think its important to track how fast earnings per share is growing, if at all. If you've also come to that realization, you're in luck, because today you can view this interactive graph of Open House Group's earnings per share history for free.
At the end of the day, it's often better to focus on companies that are free from net debt. You can access our special list of such companies (all with a track record of profit growth). It's free.
New: AI Stock Screener & Alerts
Our new AI Stock Screener scans the market every day to uncover opportunities.
• Dividend Powerhouses (3%+ Yield)
• Undervalued Small Caps with Insider Buying
• High growth Tech and AI Companies
Or build your own from over 50 metrics.
Have feedback on this article? Concerned about the content? Get in touch with us directly. Alternatively, email editorial-team (at) simplywallst.com.
This article by Simply Wall St is general in nature. We provide commentary based on historical data and analyst forecasts only using an unbiased methodology and our articles are not intended to be financial advice. It does not constitute a recommendation to buy or sell any stock, and does not take account of your objectives, or your financial situation. We aim to bring you long-term focused analysis driven by fundamental data. Note that our analysis may not factor in the latest price-sensitive company announcements or qualitative material. Simply Wall St has no position in any stocks mentioned.
About TSE:3288
Established dividend payer with adequate balance sheet.
Similar Companies
Market Insights

Advertisement
Community Narratives
The company that turned a verb into a global necessity and basically runs the modern internet, digital ads, smartphones, maps, and AI.
Fair Value US$300.00|10.8% undervalued
OS
Community Contributor
Flowers Foods Pays A Fair Price For Health
Fair Value US$16.12|22.0% undervalued
NV
Community Contributor
TMX Group will thrive with 33.3% profit margin and enduring market moat
Fair Value CA$49.90|3.8% overvalued
LI
Community Contributor