
Advertisement
Daidoh's (TSE:3205) Weak Earnings May Only Reveal A Part Of The Whole Picture
Daidoh Limited's (TSE:3205) recent weak earnings report didn't cause a big stock movement. Our analysis suggests that along with soft profit numbers, investors should be aware of some other underlying weaknesses in the numbers.
Check out our latest analysis for Daidoh
Examining Cashflow Against Daidoh's Earnings
In high finance, the key ratio used to measure how well a company converts reported profits into free cash flow (FCF) is the accrual ratio (from cashflow). In plain english, this ratio subtracts FCF from net profit, and divides that number by the company's average operating assets over that period. You could think of the accrual ratio from cashflow as the 'non-FCF profit ratio'.
As a result, a negative accrual ratio is a positive for the company, and a positive accrual ratio is a negative. That is not intended to imply we should worry about a positive accrual ratio, but it's worth noting where the accrual ratio is rather high. Notably, there is some academic evidence that suggests that a high accrual ratio is a bad sign for near-term profits, generally speaking.
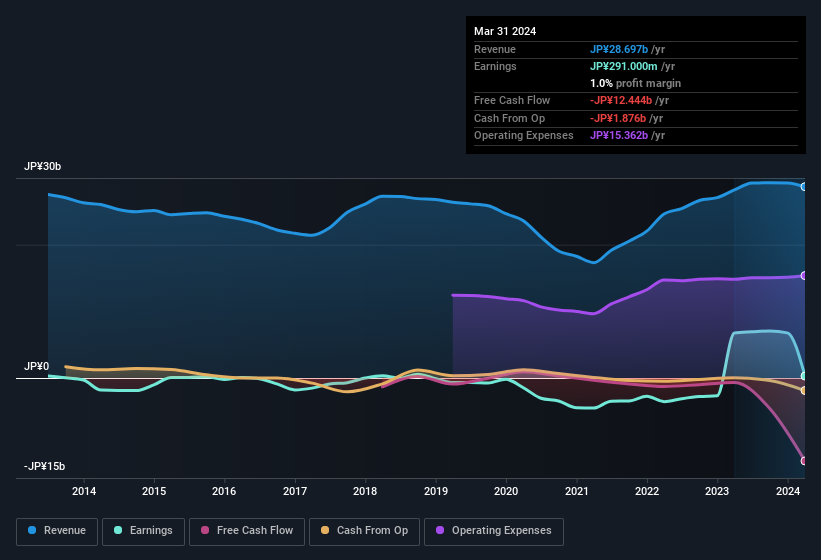
Over the twelve months to March 2024, Daidoh recorded an accrual ratio of 0.76. Statistically speaking, that's a real negative for future earnings. And indeed, during the period the company didn't produce any free cash flow whatsoever. Over the last year it actually had negative free cash flow of JP¥12b, in contrast to the aforementioned profit of JP¥291.0m. Coming off the back of negative free cash flow last year, we imagine some shareholders might wonder if its cash burn of JP¥12b, this year, indicates high risk. Having said that, there is more to the story. The accrual ratio is reflecting the impact of unusual items on statutory profit, at least in part.
Note: we always recommend investors check balance sheet strength. Click here to be taken to our balance sheet analysis of Daidoh.
The Impact Of Unusual Items On Profit
Unfortunately (in the short term) Daidoh saw its profit reduced by unusual items worth JP¥127m. In the case where this was a non-cash charge it would have made it easier to have high cash conversion, so it's surprising that the accrual ratio tells a different story. It's never great to see unusual items costing the company profits, but on the upside, things might improve sooner rather than later. We looked at thousands of listed companies and found that unusual items are very often one-off in nature. And that's hardly a surprise given these line items are considered unusual. Assuming those unusual expenses don't come up again, we'd therefore expect Daidoh to produce a higher profit next year, all else being equal.
Our Take On Daidoh's Profit Performance
In conclusion, Daidoh's accrual ratio suggests that its statutory earnings are not backed by cash flow, even though unusual items weighed on profit. Having considered these factors, we don't think Daidoh's statutory profits give an overly harsh view of the business. With this in mind, we wouldn't consider investing in a stock unless we had a thorough understanding of the risks. Be aware that Daidoh is showing 5 warning signs in our investment analysis and 3 of those are potentially serious...
Our examination of Daidoh has focussed on certain factors that can make its earnings look better than they are. But there are plenty of other ways to inform your opinion of a company. For example, many people consider a high return on equity as an indication of favorable business economics, while others like to 'follow the money' and search out stocks that insiders are buying. So you may wish to see this free collection of companies boasting high return on equity, or this list of stocks with high insider ownership.
New: Manage All Your Stock Portfolios in One Place
We've created the ultimate portfolio companion for stock investors, and it's free.
• Connect an unlimited number of Portfolios and see your total in one currency
• Be alerted to new Warning Signs or Risks via email or mobile
• Track the Fair Value of your stocks
Have feedback on this article? Concerned about the content? Get in touch with us directly. Alternatively, email editorial-team (at) simplywallst.com.
This article by Simply Wall St is general in nature. We provide commentary based on historical data and analyst forecasts only using an unbiased methodology and our articles are not intended to be financial advice. It does not constitute a recommendation to buy or sell any stock, and does not take account of your objectives, or your financial situation. We aim to bring you long-term focused analysis driven by fundamental data. Note that our analysis may not factor in the latest price-sensitive company announcements or qualitative material. Simply Wall St has no position in any stocks mentioned.
About TSE:3205
Daidoh
Manufactures and sells ready-made men's and women’s clothing and accessories in Japan.
Fair value second-rate dividend payer.
Market Insights

Advertisement
Community Narratives
Finding The True Value Of A Logistics Powerhouse
Fair Value US$95.21|7.5% undervalued
NV
Community Contributor
Paradigm Biopharmaceuticals Will Lead Osteoarthritis Treatment with Zilosul's FDA Success
Fair Value AU$5.50|91.8% undervalued
AM
Community Contributor
Barrick Mining (ABX:CA): A Gold Hedge against a U.S. Shutdown
Fair Value CA$60.00|26.4% undervalued
GM
Community Contributor