
Advertisement
- Japan
- /
- Professional Services
- /
- TSE:9556
INTLOOP (TSE:9556) Is Posting Promising Earnings But The Good News Doesn’t Stop There
The market seemed underwhelmed by the solid earnings posted by INTLOOP Inc. (TSE:9556) recently. Our analysis suggests that there are some reasons for hope that investors should be aware of.
Zooming In On INTLOOP's Earnings
One key financial ratio used to measure how well a company converts its profit to free cash flow (FCF) is the accrual ratio. In plain english, this ratio subtracts FCF from net profit, and divides that number by the company's average operating assets over that period. You could think of the accrual ratio from cashflow as the 'non-FCF profit ratio'.
As a result, a negative accrual ratio is a positive for the company, and a positive accrual ratio is a negative. While having an accrual ratio above zero is of little concern, we do think it's worth noting when a company has a relatively high accrual ratio. Notably, there is some academic evidence that suggests that a high accrual ratio is a bad sign for near-term profits, generally speaking.
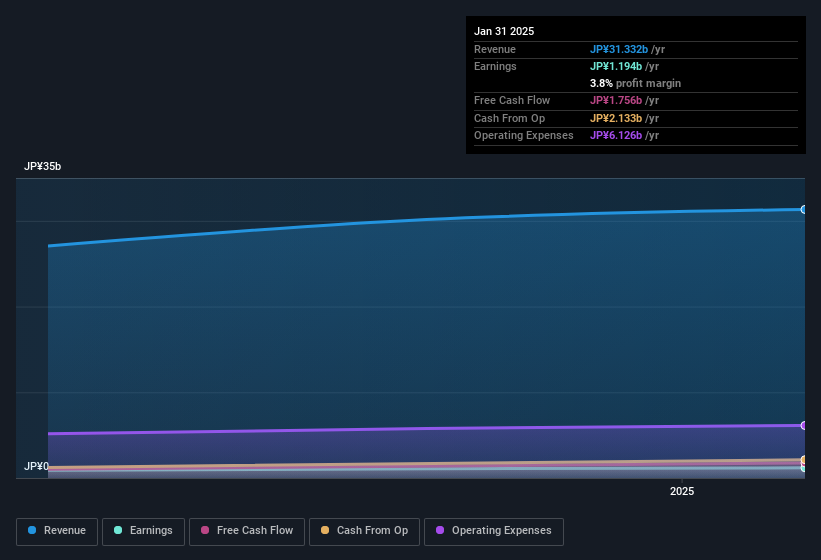
Over the twelve months to January 2025, INTLOOP recorded an accrual ratio of -0.46. That implies it has very good cash conversion, and that its earnings in the last year actually significantly understate its free cash flow. Indeed, in the last twelve months it reported free cash flow of JP¥1.8b, well over the JP¥1.19b it reported in profit. Unfortunately, we don't have data on INTLOOP's free cash flow for the prior year; that's not necessarily a bad thing, though we do generally prefer to be able to see a bit of a company's history.
That might leave you wondering what analysts are forecasting in terms of future profitability. Luckily, you can click here to see an interactive graph depicting future profitability, based on their estimates.
Our Take On INTLOOP's Profit Performance
Happily for shareholders, INTLOOP produced plenty of free cash flow to back up its statutory profit numbers. Because of this, we think INTLOOP's underlying earnings potential is as good as, or possibly even better, than the statutory profit makes it seem! Of course, we've only just scratched the surface when it comes to analysing its earnings; one could also consider margins, forecast growth, and return on investment, among other factors. So if you'd like to dive deeper into this stock, it's crucial to consider any risks it's facing. For example - INTLOOP has 2 warning signs we think you should be aware of.
Today we've zoomed in on a single data point to better understand the nature of INTLOOP's profit. But there are plenty of other ways to inform your opinion of a company. For example, many people consider a high return on equity as an indication of favorable business economics, while others like to 'follow the money' and search out stocks that insiders are buying. While it might take a little research on your behalf, you may find this free collection of companies boasting high return on equity, or this list of stocks with significant insider holdings to be useful.
New: AI Stock Screener & Alerts
Our new AI Stock Screener scans the market every day to uncover opportunities.
• Dividend Powerhouses (3%+ Yield)
• Undervalued Small Caps with Insider Buying
• High growth Tech and AI Companies
Or build your own from over 50 metrics.
Have feedback on this article? Concerned about the content? Get in touch with us directly. Alternatively, email editorial-team (at) simplywallst.com.
This article by Simply Wall St is general in nature. We provide commentary based on historical data and analyst forecasts only using an unbiased methodology and our articles are not intended to be financial advice. It does not constitute a recommendation to buy or sell any stock, and does not take account of your objectives, or your financial situation. We aim to bring you long-term focused analysis driven by fundamental data. Note that our analysis may not factor in the latest price-sensitive company announcements or qualitative material. Simply Wall St has no position in any stocks mentioned.
About TSE:9556
INTLOOP
Provides system development, network construction, infrastructure implementation, and IT human resources services in Japan.
Exceptional growth potential with excellent balance sheet.
Market Insights

Advertisement
Community Narratives
MINISO's fair value is projected at 26.69 with an anticipated PE ratio shift of 20x
Fair Value US$24.03|11.4% undervalued
BE
Community Contributor
Procter & Gamble: A Dividend Giant Facing Slowing Growth
Fair Value US$119.81|23.5% overvalued
AN
Community Contributor
Eli Lilly's Future Growth Driven by Tirzepatide and Favorable Market Conditions
Fair Value US$1.19k|14.0% undervalued
EA
Community Contributor