
Advertisement
- Japan
- /
- Professional Services
- /
- TSE:9556
Here's What To Make Of INTLOOP's (TSE:9556) Decelerating Rates Of Return
If we want to find a stock that could multiply over the long term, what are the underlying trends we should look for? Firstly, we'd want to identify a growing return on capital employed (ROCE) and then alongside that, an ever-increasing base of capital employed. If you see this, it typically means it's a company with a great business model and plenty of profitable reinvestment opportunities. Having said that, while the ROCE is currently high for INTLOOP (TSE:9556), we aren't jumping out of our chairs because returns are decreasing.
Understanding Return On Capital Employed (ROCE)
Just to clarify if you're unsure, ROCE is a metric for evaluating how much pre-tax income (in percentage terms) a company earns on the capital invested in its business. The formula for this calculation on INTLOOP is:
Return on Capital Employed = Earnings Before Interest and Tax (EBIT) ÷ (Total Assets - Current Liabilities)
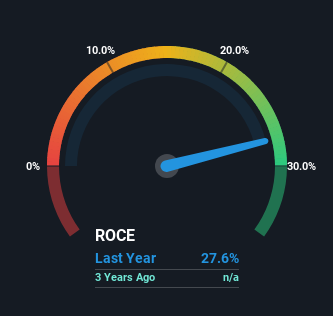
0.28 = JP¥2.0b ÷ (JP¥13b - JP¥5.4b) (Based on the trailing twelve months to January 2025).
Therefore, INTLOOP has an ROCE of 28%. In absolute terms that's a great return and it's even better than the Professional Services industry average of 17%.
See our latest analysis for INTLOOP
Above you can see how the current ROCE for INTLOOP compares to its prior returns on capital, but there's only so much you can tell from the past. If you'd like to see what analysts are forecasting going forward, you should check out our free analyst report for INTLOOP .
What Can We Tell From INTLOOP's ROCE Trend?
There hasn't been much to report for INTLOOP's returns and its level of capital employed because both metrics have been steady for the past . Businesses with these traits tend to be mature and steady operations because they're past the growth phase. So it may not be a multi-bagger in the making, but given the decent 28% return on capital, it'd be difficult to find fault with the business's current operations.
On a side note, INTLOOP's current liabilities are still rather high at 43% of total assets. This can bring about some risks because the company is basically operating with a rather large reliance on its suppliers or other sorts of short-term creditors. While it's not necessarily a bad thing, it can be beneficial if this ratio is lower.
The Bottom Line
In summary, INTLOOP isn't compounding its earnings but is generating decent returns on the same amount of capital employed. Since the stock has gained an impressive 79% over the last year, investors must think there's better things to come. Ultimately, if the underlying trends persist, we wouldn't hold our breath on it being a multi-bagger going forward.
One more thing to note, we've identified 1 warning sign with INTLOOP and understanding this should be part of your investment process.
High returns are a key ingredient to strong performance, so check out our free list ofstocks earning high returns on equity with solid balance sheets.
New: AI Stock Screener & Alerts
Our new AI Stock Screener scans the market every day to uncover opportunities.
• Dividend Powerhouses (3%+ Yield)
• Undervalued Small Caps with Insider Buying
• High growth Tech and AI Companies
Or build your own from over 50 metrics.
Have feedback on this article? Concerned about the content? Get in touch with us directly. Alternatively, email editorial-team (at) simplywallst.com.
This article by Simply Wall St is general in nature. We provide commentary based on historical data and analyst forecasts only using an unbiased methodology and our articles are not intended to be financial advice. It does not constitute a recommendation to buy or sell any stock, and does not take account of your objectives, or your financial situation. We aim to bring you long-term focused analysis driven by fundamental data. Note that our analysis may not factor in the latest price-sensitive company announcements or qualitative material. Simply Wall St has no position in any stocks mentioned.
About TSE:9556
INTLOOP
Provides system development, network construction, infrastructure implementation, and IT human resources services in Japan.
Exceptional growth potential with excellent balance sheet.
Market Insights

Advertisement
Community Narratives
MINISO's fair value is projected at 26.69 with an anticipated PE ratio shift of 20x
Fair Value US$24.03|11.4% undervalued
BE
Community Contributor
Procter & Gamble: A Dividend Giant Facing Slowing Growth
Fair Value US$119.81|23.5% overvalued
AN
Community Contributor
Eli Lilly's Future Growth Driven by Tirzepatide and Favorable Market Conditions
Fair Value US$1.19k|14.0% undervalued
EA
Community Contributor