
Advertisement
- Japan
- /
- Commercial Services
- /
- TSE:7922
Optimistic Investors Push Sanko Sangyo Co.,Ltd. (TSE:7922) Shares Up 27% But Growth Is Lacking
Sanko Sangyo Co.,Ltd. (TSE:7922) shares have had a really impressive month, gaining 27% after a shaky period beforehand. The bad news is that even after the stocks recovery in the last 30 days, shareholders are still underwater by about 2.4% over the last year.
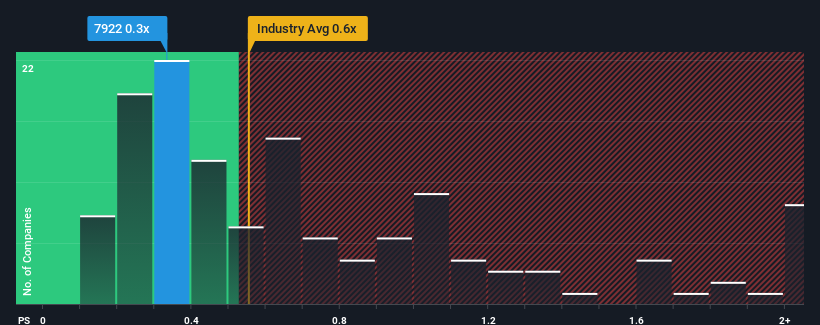
Even after such a large jump in price, you could still be forgiven for feeling indifferent about Sanko SangyoLtd's P/S ratio of 0.3x, since the median price-to-sales (or "P/S") ratio for the Commercial Services industry in Japan is also close to 0.6x. Although, it's not wise to simply ignore the P/S without explanation as investors may be disregarding a distinct opportunity or a costly mistake.
Check out our latest analysis for Sanko SangyoLtd
What Does Sanko SangyoLtd's P/S Mean For Shareholders?
For example, consider that Sanko SangyoLtd's financial performance has been poor lately as its revenue has been in decline. Perhaps investors believe the recent revenue performance is enough to keep in line with the industry, which is keeping the P/S from dropping off. If not, then existing shareholders may be a little nervous about the viability of the share price.
Although there are no analyst estimates available for Sanko SangyoLtd, take a look at this free data-rich visualisation to see how the company stacks up on earnings, revenue and cash flow.Is There Some Revenue Growth Forecasted For Sanko SangyoLtd?
In order to justify its P/S ratio, Sanko SangyoLtd would need to produce growth that's similar to the industry.
Retrospectively, the last year delivered a frustrating 7.3% decrease to the company's top line. The last three years don't look nice either as the company has shrunk revenue by 7.8% in aggregate. Accordingly, shareholders would have felt downbeat about the medium-term rates of revenue growth.
Comparing that to the industry, which is predicted to deliver 5.3% growth in the next 12 months, the company's downward momentum based on recent medium-term revenue results is a sobering picture.
In light of this, it's somewhat alarming that Sanko SangyoLtd's P/S sits in line with the majority of other companies. Apparently many investors in the company are way less bearish than recent times would indicate and aren't willing to let go of their stock right now. There's a good chance existing shareholders are setting themselves up for future disappointment if the P/S falls to levels more in line with the recent negative growth rates.
What We Can Learn From Sanko SangyoLtd's P/S?
Sanko SangyoLtd appears to be back in favour with a solid price jump bringing its P/S back in line with other companies in the industry While the price-to-sales ratio shouldn't be the defining factor in whether you buy a stock or not, it's quite a capable barometer of revenue expectations.
We find it unexpected that Sanko SangyoLtd trades at a P/S ratio that is comparable to the rest of the industry, despite experiencing declining revenues during the medium-term, while the industry as a whole is expected to grow. When we see revenue heading backwards in the context of growing industry forecasts, it'd make sense to expect a possible share price decline on the horizon, sending the moderate P/S lower. Unless the the circumstances surrounding the recent medium-term improve, it wouldn't be wrong to expect a a difficult period ahead for the company's shareholders.
And what about other risks? Every company has them, and we've spotted 3 warning signs for Sanko SangyoLtd (of which 1 shouldn't be ignored!) you should know about.
If strong companies turning a profit tickle your fancy, then you'll want to check out this free list of interesting companies that trade on a low P/E (but have proven they can grow earnings).
New: Manage All Your Stock Portfolios in One Place
We've created the ultimate portfolio companion for stock investors, and it's free.
• Connect an unlimited number of Portfolios and see your total in one currency
• Be alerted to new Warning Signs or Risks via email or mobile
• Track the Fair Value of your stocks
Have feedback on this article? Concerned about the content? Get in touch with us directly. Alternatively, email editorial-team (at) simplywallst.com.
This article by Simply Wall St is general in nature. We provide commentary based on historical data and analyst forecasts only using an unbiased methodology and our articles are not intended to be financial advice. It does not constitute a recommendation to buy or sell any stock, and does not take account of your objectives, or your financial situation. We aim to bring you long-term focused analysis driven by fundamental data. Note that our analysis may not factor in the latest price-sensitive company announcements or qualitative material. Simply Wall St has no position in any stocks mentioned.
About TSE:7922
Sanko SangyoLtd
Engages in the manufacture and sale of printed materials in Japan.
Excellent balance sheet and fair value.
Market Insights

Advertisement
Community Narratives
Groundbreaking therapies that could change the treatment landscape for PTSD, fibromyalgia, MS & Alzheimer’s
Fair Value US$6.20|86.8% undervalued
CM
Community Contributor
DigitalOcean Will Grow 14% by Embracing AI with Paperspace Acquisition
Fair Value US$50.00|43.5% undervalued
NE
Community Contributor
Viant Technology: A Rising AdTech Challenger in the AI-Powered CTV Market
Fair Value US$38.61|61.4% undervalued
BL
Community Contributor
Volvo will Accelerate Forward into Electric and Autonomous Leadership in Five Years
Fair Value SEK 438.80|40.9% undervalued
UN
Community Contributor