
Advertisement
- Japan
- /
- Professional Services
- /
- TSE:7781
HIRAYAMA HOLDINGSLtd (TSE:7781) Shareholders Will Want The ROCE Trajectory To Continue

If we want to find a stock that could multiply over the long term, what are the underlying trends we should look for? One common approach is to try and find a company with returns on capital employed (ROCE) that are increasing, in conjunction with a growing amount of capital employed. Put simply, these types of businesses are compounding machines, meaning they are continually reinvesting their earnings at ever-higher rates of return. So on that note, HIRAYAMA HOLDINGSLtd (TSE:7781) looks quite promising in regards to its trends of return on capital.
What Is Return On Capital Employed (ROCE)?
For those that aren't sure what ROCE is, it measures the amount of pre-tax profits a company can generate from the capital employed in its business. Analysts use this formula to calculate it for HIRAYAMA HOLDINGSLtd:
Return on Capital Employed = Earnings Before Interest and Tax (EBIT) ÷ (Total Assets - Current Liabilities)
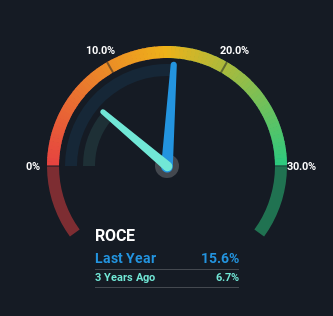
0.16 = JP¥984m ÷ (JP¥11b - JP¥4.7b) (Based on the trailing twelve months to December 2023).
Therefore, HIRAYAMA HOLDINGSLtd has an ROCE of 16%. That's a relatively normal return on capital, and it's around the 15% generated by the Professional Services industry.
View our latest analysis for HIRAYAMA HOLDINGSLtd
While the past is not representative of the future, it can be helpful to know how a company has performed historically, which is why we have this chart above. If you're interested in investigating HIRAYAMA HOLDINGSLtd's past further, check out this free graph covering HIRAYAMA HOLDINGSLtd's past earnings, revenue and cash flow.
The Trend Of ROCE
The trends we've noticed at HIRAYAMA HOLDINGSLtd are quite reassuring. The data shows that returns on capital have increased substantially over the last five years to 16%. The amount of capital employed has increased too, by 40%. So we're very much inspired by what we're seeing at HIRAYAMA HOLDINGSLtd thanks to its ability to profitably reinvest capital.
Another thing to note, HIRAYAMA HOLDINGSLtd has a high ratio of current liabilities to total assets of 43%. This effectively means that suppliers (or short-term creditors) are funding a large portion of the business, so just be aware that this can introduce some elements of risk. While it's not necessarily a bad thing, it can be beneficial if this ratio is lower.
The Bottom Line
In summary, it's great to see that HIRAYAMA HOLDINGSLtd can compound returns by consistently reinvesting capital at increasing rates of return, because these are some of the key ingredients of those highly sought after multi-baggers. And with the stock having performed exceptionally well over the last five years, these patterns are being accounted for by investors. Therefore, we think it would be worth your time to check if these trends are going to continue.
Like most companies, HIRAYAMA HOLDINGSLtd does come with some risks, and we've found 3 warning signs that you should be aware of.
While HIRAYAMA HOLDINGSLtd isn't earning the highest return, check out this free list of companies that are earning high returns on equity with solid balance sheets.
Valuation is complex, but we're here to simplify it.
Discover if HIRAYAMA HOLDINGSLtd might be undervalued or overvalued with our detailed analysis, featuring fair value estimates, potential risks, dividends, insider trades, and its financial condition.
Access Free AnalysisHave feedback on this article? Concerned about the content? Get in touch with us directly. Alternatively, email editorial-team (at) simplywallst.com.
This article by Simply Wall St is general in nature. We provide commentary based on historical data and analyst forecasts only using an unbiased methodology and our articles are not intended to be financial advice. It does not constitute a recommendation to buy or sell any stock, and does not take account of your objectives, or your financial situation. We aim to bring you long-term focused analysis driven by fundamental data. Note that our analysis may not factor in the latest price-sensitive company announcements or qualitative material. Simply Wall St has no position in any stocks mentioned.
About TSE:7781
HIRAYAMA HOLDINGSLtd
Provides in-sourcing and temporary staffing services.
Flawless balance sheet with solid track record and pays a dividend.
Market Insights

Advertisement
Community Narratives
Groundbreaking therapies that could change the treatment landscape for PTSD, fibromyalgia, MS & Alzheimer’s
Fair Value US$6.20|86.9% undervalued
CM
Community Contributor
DigitalOcean Will Grow 14% by Embracing AI with Paperspace Acquisition
Fair Value US$50.00|41.7% undervalued
NE
Community Contributor
Viant Technology: A Rising AdTech Challenger in the AI-Powered CTV Market
Fair Value US$38.61|63.2% undervalued
BL
Community Contributor
Volvo will Accelerate Forward into Electric and Autonomous Leadership in Five Years
Fair Value SEK 438.80|39.7% undervalued
UN
Community Contributor