
Advertisement

Warren Buffett famously said, 'Volatility is far from synonymous with risk.' When we think about how risky a company is, we always like to look at its use of debt, since debt overload can lead to ruin. We note that Peers Co.,Ltd. (TSE:7066) does have debt on its balance sheet. But the real question is whether this debt is making the company risky.
When Is Debt Dangerous?
Debt assists a business until the business has trouble paying it off, either with new capital or with free cash flow. In the worst case scenario, a company can go bankrupt if it cannot pay its creditors. However, a more usual (but still expensive) situation is where a company must dilute shareholders at a cheap share price simply to get debt under control. By replacing dilution, though, debt can be an extremely good tool for businesses that need capital to invest in growth at high rates of return. The first thing to do when considering how much debt a business uses is to look at its cash and debt together.
How Much Debt Does PeersLtd Carry?
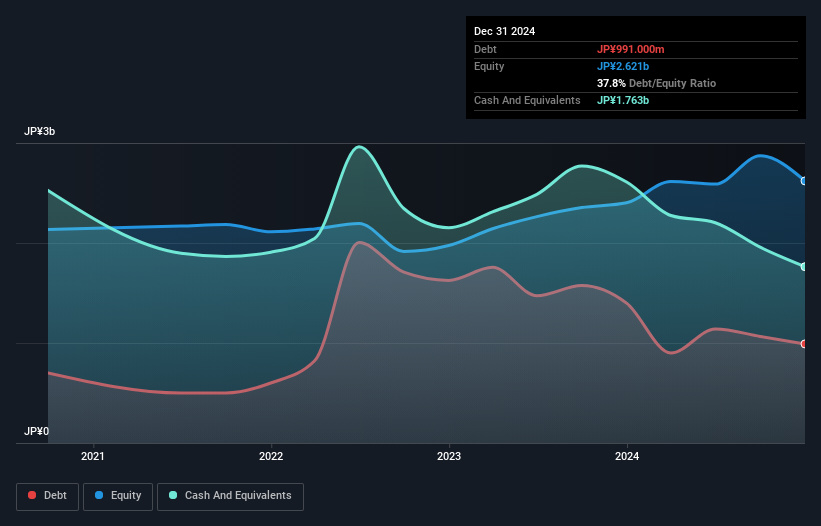
The image below, which you can click on for greater detail, shows that PeersLtd had debt of JP¥991.0m at the end of December 2024, a reduction from JP¥1.40b over a year. However, its balance sheet shows it holds JP¥1.76b in cash, so it actually has JP¥772.0m net cash.
How Healthy Is PeersLtd's Balance Sheet?
According to the last reported balance sheet, PeersLtd had liabilities of JP¥913.0m due within 12 months, and liabilities of JP¥706.0m due beyond 12 months. On the other hand, it had cash of JP¥1.76b and JP¥718.0m worth of receivables due within a year. So it can boast JP¥862.0m more liquid assets than total liabilities.
This excess liquidity suggests that PeersLtd is taking a careful approach to debt. Given it has easily adequate short term liquidity, we don't think it will have any issues with its lenders. Succinctly put, PeersLtd boasts net cash, so it's fair to say it does not have a heavy debt load!
See our latest analysis for PeersLtd
But the bad news is that PeersLtd has seen its EBIT plunge 15% in the last twelve months. If that rate of decline in earnings continues, the company could find itself in a tight spot. When analysing debt levels, the balance sheet is the obvious place to start. But you can't view debt in total isolation; since PeersLtd will need earnings to service that debt. So when considering debt, it's definitely worth looking at the earnings trend. Click here for an interactive snapshot .
Finally, while the tax-man may adore accounting profits, lenders only accept cold hard cash. While PeersLtd has net cash on its balance sheet, it's still worth taking a look at its ability to convert earnings before interest and tax (EBIT) to free cash flow, to help us understand how quickly it is building (or eroding) that cash balance. In the last three years, PeersLtd's free cash flow amounted to 39% of its EBIT, less than we'd expect. That's not great, when it comes to paying down debt.
Summing Up
While it is always sensible to investigate a company's debt, in this case PeersLtd has JP¥772.0m in net cash and a decent-looking balance sheet. So we don't have any problem with PeersLtd's use of debt. There's no doubt that we learn most about debt from the balance sheet. But ultimately, every company can contain risks that exist outside of the balance sheet. These risks can be hard to spot. Every company has them, and we've spotted 4 warning signs for PeersLtd you should know about.
At the end of the day, it's often better to focus on companies that are free from net debt. You can access our special list of such companies (all with a track record of profit growth). It's free.
New: Manage All Your Stock Portfolios in One Place
We've created the ultimate portfolio companion for stock investors, and it's free.
• Connect an unlimited number of Portfolios and see your total in one currency
• Be alerted to new Warning Signs or Risks via email or mobile
• Track the Fair Value of your stocks
Have feedback on this article? Concerned about the content? Get in touch with us directly. Alternatively, email editorial-team (at) simplywallst.com.
This article by Simply Wall St is general in nature. We provide commentary based on historical data and analyst forecasts only using an unbiased methodology and our articles are not intended to be financial advice. It does not constitute a recommendation to buy or sell any stock, and does not take account of your objectives, or your financial situation. We aim to bring you long-term focused analysis driven by fundamental data. Note that our analysis may not factor in the latest price-sensitive company announcements or qualitative material. Simply Wall St has no position in any stocks mentioned.
About TSE:7066
Excellent balance sheet with proven track record.
Market Insights

Advertisement
Community Narratives

BMW cruising ahead with new EVs and premium models to boost revenue 5%
Fair Value €135.07|44.5% undervalued
UN
Community Contributor
EU#2 - From Humble Beginnings to Global Powerhouse
Fair Value DKK 851.04|46.1% undervalued
TO
Community Contributor