
Advertisement
- Japan
- /
- Professional Services
- /
- TSE:7066
These 4 Measures Indicate That PeersLtd (TSE:7066) Is Using Debt Safely
Howard Marks put it nicely when he said that, rather than worrying about share price volatility, 'The possibility of permanent loss is the risk I worry about... and every practical investor I know worries about.' It's only natural to consider a company's balance sheet when you examine how risky it is, since debt is often involved when a business collapses. Importantly, Peers Co.,Ltd. (TSE:7066) does carry debt. But the more important question is: how much risk is that debt creating?
Why Does Debt Bring Risk?
Debt and other liabilities become risky for a business when it cannot easily fulfill those obligations, either with free cash flow or by raising capital at an attractive price. In the worst case scenario, a company can go bankrupt if it cannot pay its creditors. While that is not too common, we often do see indebted companies permanently diluting shareholders because lenders force them to raise capital at a distressed price. Having said that, the most common situation is where a company manages its debt reasonably well - and to its own advantage. The first step when considering a company's debt levels is to consider its cash and debt together.
See our latest analysis for PeersLtd
What Is PeersLtd's Debt?
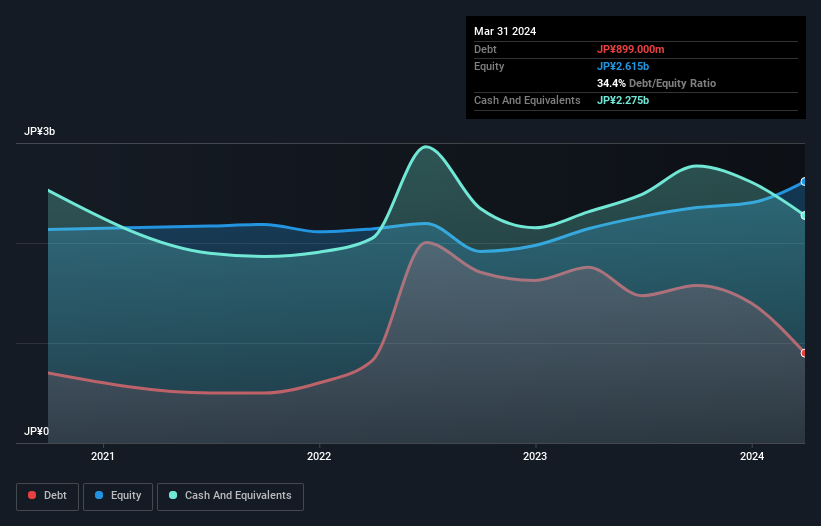
You can click the graphic below for the historical numbers, but it shows that PeersLtd had JP¥899.0m of debt in March 2024, down from JP¥1.76b, one year before. However, its balance sheet shows it holds JP¥2.28b in cash, so it actually has JP¥1.38b net cash.
How Strong Is PeersLtd's Balance Sheet?
The latest balance sheet data shows that PeersLtd had liabilities of JP¥859.0m due within a year, and liabilities of JP¥816.0m falling due after that. Offsetting this, it had JP¥2.28b in cash and JP¥713.0m in receivables that were due within 12 months. So it can boast JP¥1.31b more liquid assets than total liabilities.
This surplus suggests that PeersLtd is using debt in a way that is appears to be both safe and conservative. Because it has plenty of assets, it is unlikely to have trouble with its lenders. Succinctly put, PeersLtd boasts net cash, so it's fair to say it does not have a heavy debt load!
Even more impressive was the fact that PeersLtd grew its EBIT by 125% over twelve months. If maintained that growth will make the debt even more manageable in the years ahead. There's no doubt that we learn most about debt from the balance sheet. But it is PeersLtd's earnings that will influence how the balance sheet holds up in the future. So when considering debt, it's definitely worth looking at the earnings trend. Click here for an interactive snapshot.
Finally, a company can only pay off debt with cold hard cash, not accounting profits. While PeersLtd has net cash on its balance sheet, it's still worth taking a look at its ability to convert earnings before interest and tax (EBIT) to free cash flow, to help us understand how quickly it is building (or eroding) that cash balance. Over the last two years, PeersLtd actually produced more free cash flow than EBIT. There's nothing better than incoming cash when it comes to staying in your lenders' good graces.
Summing Up
While we empathize with investors who find debt concerning, you should keep in mind that PeersLtd has net cash of JP¥1.38b, as well as more liquid assets than liabilities. And it impressed us with free cash flow of JP¥670m, being 109% of its EBIT. The bottom line is that we do not find PeersLtd's debt levels at all concerning. The balance sheet is clearly the area to focus on when you are analysing debt. But ultimately, every company can contain risks that exist outside of the balance sheet. For example - PeersLtd has 4 warning signs we think you should be aware of.
When all is said and done, sometimes its easier to focus on companies that don't even need debt. Readers can access a list of growth stocks with zero net debt 100% free, right now.
New: Manage All Your Stock Portfolios in One Place
We've created the ultimate portfolio companion for stock investors, and it's free.
• Connect an unlimited number of Portfolios and see your total in one currency
• Be alerted to new Warning Signs or Risks via email or mobile
• Track the Fair Value of your stocks
Have feedback on this article? Concerned about the content? Get in touch with us directly. Alternatively, email editorial-team (at) simplywallst.com.
This article by Simply Wall St is general in nature. We provide commentary based on historical data and analyst forecasts only using an unbiased methodology and our articles are not intended to be financial advice. It does not constitute a recommendation to buy or sell any stock, and does not take account of your objectives, or your financial situation. We aim to bring you long-term focused analysis driven by fundamental data. Note that our analysis may not factor in the latest price-sensitive company announcements or qualitative material. Simply Wall St has no position in any stocks mentioned.
Have feedback on this article? Concerned about the content? Get in touch with us directly. Alternatively, email editorial-team@simplywallst.com
About TSE:7066
Solid track record with excellent balance sheet.
Market Insights

Advertisement
Community Narratives
The Next Phase of Energy Storage: How NeoVolta Is Tackling America’s Power Crunch
Fair Value US$7.50|35.1% undervalued
MA
Community Contributor
Why EnSilica is Worth Possibly 13x its Current Price
Fair Value UK£5.00|89.5% undervalued
DO
Community Contributor
M&A Activity, Industry Diversification & A Defense Contract Monopoly Will Push BWXT For Healthy Long-Term Growth
Fair Value US$220.00|15.2% undervalued
CL
Community Contributor
A case for Cassiar Gold Corp (TSXV: GLDC) to reach CAD$8-10 before 2030 (X30-37)
Fair Value CA$10.00|96.0% undervalued
AG
Community Contributor