
Advertisement

Some say volatility, rather than debt, is the best way to think about risk as an investor, but Warren Buffett famously said that 'Volatility is far from synonymous with risk.' So it might be obvious that you need to consider debt, when you think about how risky any given stock is, because too much debt can sink a company. We can see that Inbound Tech Inc. (TSE:7031) does use debt in its business. But the more important question is: how much risk is that debt creating?
Why Does Debt Bring Risk?
Debt and other liabilities become risky for a business when it cannot easily fulfill those obligations, either with free cash flow or by raising capital at an attractive price. In the worst case scenario, a company can go bankrupt if it cannot pay its creditors. However, a more frequent (but still costly) occurrence is where a company must issue shares at bargain-basement prices, permanently diluting shareholders, just to shore up its balance sheet. By replacing dilution, though, debt can be an extremely good tool for businesses that need capital to invest in growth at high rates of return. When we examine debt levels, we first consider both cash and debt levels, together.
View our latest analysis for Inbound Tech
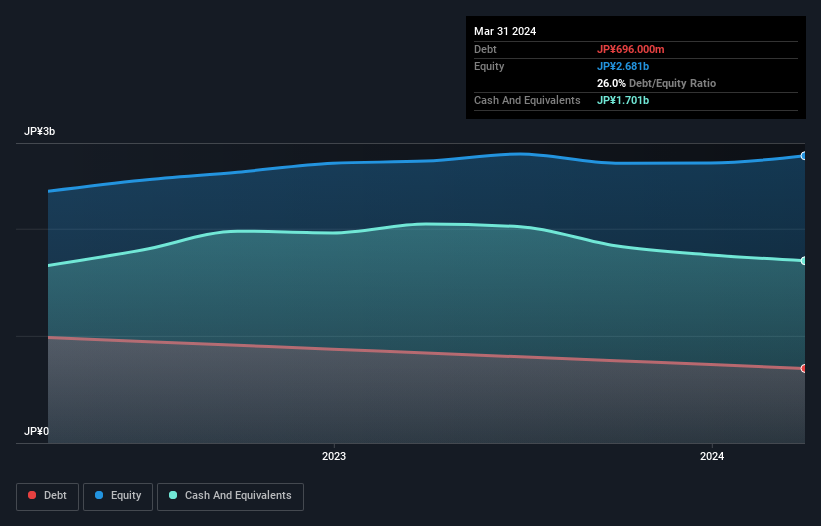
What Is Inbound Tech's Debt?
As you can see below, Inbound Tech had JP¥696.0m of debt at March 2024, down from JP¥840.0m a year prior. However, it does have JP¥1.70b in cash offsetting this, leading to net cash of JP¥1.01b.
A Look At Inbound Tech's Liabilities
The latest balance sheet data shows that Inbound Tech had liabilities of JP¥842.0m due within a year, and liabilities of JP¥254.0m falling due after that. Offsetting this, it had JP¥1.70b in cash and JP¥535.0m in receivables that were due within 12 months. So it can boast JP¥1.14b more liquid assets than total liabilities.
This excess liquidity is a great indication that Inbound Tech's balance sheet is almost as strong as Fort Knox. On this view, lenders should feel as safe as the beloved of a black-belt karate master. Simply put, the fact that Inbound Tech has more cash than debt is arguably a good indication that it can manage its debt safely.
On the other hand, Inbound Tech's EBIT dived 16%, over the last year. If that rate of decline in earnings continues, the company could find itself in a tight spot. When analysing debt levels, the balance sheet is the obvious place to start. But it is Inbound Tech's earnings that will influence how the balance sheet holds up in the future. So if you're keen to discover more about its earnings, it might be worth checking out this graph of its long term earnings trend.
Finally, while the tax-man may adore accounting profits, lenders only accept cold hard cash. While Inbound Tech has net cash on its balance sheet, it's still worth taking a look at its ability to convert earnings before interest and tax (EBIT) to free cash flow, to help us understand how quickly it is building (or eroding) that cash balance. During the last three years, Inbound Tech produced sturdy free cash flow equating to 76% of its EBIT, about what we'd expect. This free cash flow puts the company in a good position to pay down debt, when appropriate.
Summing Up
While it is always sensible to investigate a company's debt, in this case Inbound Tech has JP¥1.01b in net cash and a decent-looking balance sheet. The cherry on top was that in converted 76% of that EBIT to free cash flow, bringing in JP¥37m. So we don't think Inbound Tech's use of debt is risky. The balance sheet is clearly the area to focus on when you are analysing debt. However, not all investment risk resides within the balance sheet - far from it. Case in point: We've spotted 1 warning sign for Inbound Tech you should be aware of.
If you're interested in investing in businesses that can grow profits without the burden of debt, then check out this free list of growing businesses that have net cash on the balance sheet.
New: AI Stock Screener & Alerts
Our new AI Stock Screener scans the market every day to uncover opportunities.
• Dividend Powerhouses (3%+ Yield)
• Undervalued Small Caps with Insider Buying
• High growth Tech and AI Companies
Or build your own from over 50 metrics.
Have feedback on this article? Concerned about the content? Get in touch with us directly. Alternatively, email editorial-team (at) simplywallst.com.
This article by Simply Wall St is general in nature. We provide commentary based on historical data and analyst forecasts only using an unbiased methodology and our articles are not intended to be financial advice. It does not constitute a recommendation to buy or sell any stock, and does not take account of your objectives, or your financial situation. We aim to bring you long-term focused analysis driven by fundamental data. Note that our analysis may not factor in the latest price-sensitive company announcements or qualitative material. Simply Wall St has no position in any stocks mentioned.
Have feedback on this article? Concerned about the content? Get in touch with us directly. Alternatively, email editorial-team@simplywallst.com
About TSE:7031
Inbound Tech
Engages in the Multilingual CRM and sales outsourcing businesses in Japan.
Adequate balance sheet very low.
Market Insights


Advertisement
Community Narratives
Alphabet: The Under-appreciated Compounder Hiding in Plain Sight
Fair Value US$282.83|32.8% undervalued
BL
Community Contributor
Planet Labs: At The Heart Of The Emerging New Space Boom
Fair Value US$11.31|45.4% undervalued
AN
Community Contributor
Exxon in Guyana 5 year forecast Low $135 to High $189
Fair Value US$174.00|37.0% undervalued
AG
Community Contributor