
Advertisement
- Japan
- /
- Professional Services
- /
- TSE:6551
Tsunagu Group Holdings, Inc. (TSE:6551) Stock Has Shown Weakness Lately But Financials Look Strong: Should Prospective Shareholders Make The Leap?

With its stock down 14% over the past week, it is easy to disregard Tsunagu Group Holdings (TSE:6551). But if you pay close attention, you might gather that its strong financials could mean that the stock could potentially see an increase in value in the long-term, given how markets usually reward companies with good financial health. Particularly, we will be paying attention to Tsunagu Group Holdings' ROE today.
Return on equity or ROE is a key measure used to assess how efficiently a company's management is utilizing the company's capital. In other words, it is a profitability ratio which measures the rate of return on the capital provided by the company's shareholders.
How Is ROE Calculated?
The formula for return on equity is:
Return on Equity = Net Profit (from continuing operations) ÷ Shareholders' Equity
So, based on the above formula, the ROE for Tsunagu Group Holdings is:
22% = JP¥398m ÷ JP¥1.8b (Based on the trailing twelve months to December 2024).
The 'return' is the yearly profit. That means that for every ¥1 worth of shareholders' equity, the company generated ¥0.22 in profit.
View our latest analysis for Tsunagu Group Holdings
What Has ROE Got To Do With Earnings Growth?
Thus far, we have learned that ROE measures how efficiently a company is generating its profits. We now need to evaluate how much profit the company reinvests or "retains" for future growth which then gives us an idea about the growth potential of the company. Assuming all else is equal, companies that have both a higher return on equity and higher profit retention are usually the ones that have a higher growth rate when compared to companies that don't have the same features.
A Side By Side comparison of Tsunagu Group Holdings' Earnings Growth And 22% ROE
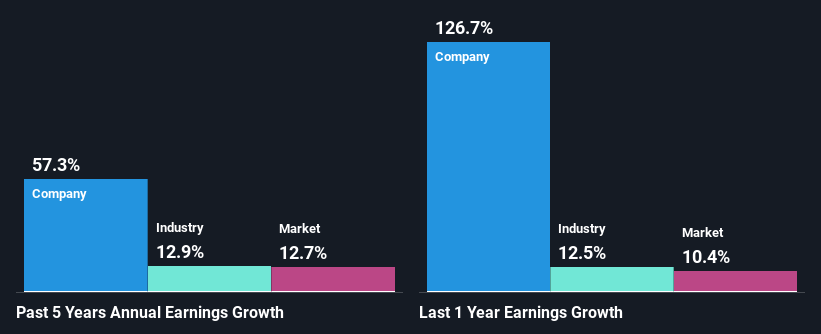
To begin with, Tsunagu Group Holdings has a pretty high ROE which is interesting. Additionally, the company's ROE is higher compared to the industry average of 15% which is quite remarkable. Under the circumstances, Tsunagu Group Holdings' considerable five year net income growth of 57% was to be expected.
As a next step, we compared Tsunagu Group Holdings' net income growth with the industry, and pleasingly, we found that the growth seen by the company is higher than the average industry growth of 13%.
Earnings growth is a huge factor in stock valuation. The investor should try to establish if the expected growth or decline in earnings, whichever the case may be, is priced in. By doing so, they will have an idea if the stock is headed into clear blue waters or if swampy waters await. Is Tsunagu Group Holdings fairly valued compared to other companies? These 3 valuation measures might help you decide.
Is Tsunagu Group Holdings Using Its Retained Earnings Effectively?
Tsunagu Group Holdings has a really low three-year median payout ratio of 24%, meaning that it has the remaining 76% left over to reinvest into its business. So it seems like the management is reinvesting profits heavily to grow its business and this reflects in its earnings growth number.
Additionally, Tsunagu Group Holdings has paid dividends over a period of six years which means that the company is pretty serious about sharing its profits with shareholders.
Summary
In total, we are pretty happy with Tsunagu Group Holdings' performance. Specifically, we like that the company is reinvesting a huge chunk of its profits at a high rate of return. This of course has caused the company to see substantial growth in its earnings. If the company continues to grow its earnings the way it has, that could have a positive impact on its share price given how earnings per share influence long-term share prices. Let's not forget, business risk is also one of the factors that affects the price of the stock. So this is also an important area that investors need to pay attention to before making a decision on any business. You can see the 3 risks we have identified for Tsunagu Group Holdings by visiting our risks dashboard for free on our platform here.
Valuation is complex, but we're here to simplify it.
Discover if Tsunagu Group Holdings might be undervalued or overvalued with our detailed analysis, featuring fair value estimates, potential risks, dividends, insider trades, and its financial condition.
Access Free AnalysisHave feedback on this article? Concerned about the content? Get in touch with us directly. Alternatively, email editorial-team (at) simplywallst.com.
This article by Simply Wall St is general in nature. We provide commentary based on historical data and analyst forecasts only using an unbiased methodology and our articles are not intended to be financial advice. It does not constitute a recommendation to buy or sell any stock, and does not take account of your objectives, or your financial situation. We aim to bring you long-term focused analysis driven by fundamental data. Note that our analysis may not factor in the latest price-sensitive company announcements or qualitative material. Simply Wall St has no position in any stocks mentioned.
About TSE:6551
Tsunagu Group Holdings
Engages in the consulting and recruitment agency services.
Flawless balance sheet and fair value.
Market Insights


Advertisement
Community Narratives
For the Emperor: Why Games Workshop Could Be a Star Investment
Fair Value UK£160.00|0.4% overvalued
RO
Community Contributor
Securitas will boost margins with AI and tech-driven services
Fair Value SEK 260.91|44.5% undervalued
UN
Community Contributor
A Leader in EV Charging with Growth Potential
Fair Value €27.00|17.8% undervalued
TI
Community Contributor