
Advertisement
- Japan
- /
- Commercial Services
- /
- TSE:6086
Returns On Capital Are A Standout For Shin Maint HoldingsLtd (TSE:6086)
If we want to find a stock that could multiply over the long term, what are the underlying trends we should look for? One common approach is to try and find a company with returns on capital employed (ROCE) that are increasing, in conjunction with a growing amount of capital employed. Ultimately, this demonstrates that it's a business that is reinvesting profits at increasing rates of return. So when we looked at the ROCE trend of Shin Maint HoldingsLtd (TSE:6086) we really liked what we saw.
Return On Capital Employed (ROCE): What Is It?
Just to clarify if you're unsure, ROCE is a metric for evaluating how much pre-tax income (in percentage terms) a company earns on the capital invested in its business. Analysts use this formula to calculate it for Shin Maint HoldingsLtd:
Return on Capital Employed = Earnings Before Interest and Tax (EBIT) ÷ (Total Assets - Current Liabilities)
0.40 = JP¥1.6b ÷ (JP¥8.8b - JP¥4.8b) (Based on the trailing twelve months to November 2024).
Therefore, Shin Maint HoldingsLtd has an ROCE of 40%. That's a fantastic return and not only that, it outpaces the average of 9.8% earned by companies in a similar industry.
View our latest analysis for Shin Maint HoldingsLtd
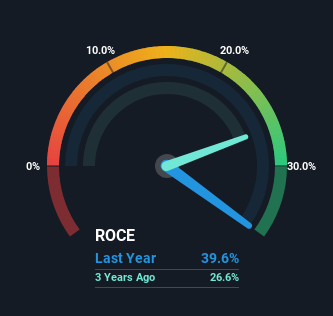
Above you can see how the current ROCE for Shin Maint HoldingsLtd compares to its prior returns on capital, but there's only so much you can tell from the past. If you'd like to see what analysts are forecasting going forward, you should check out our free analyst report for Shin Maint HoldingsLtd .
What Does the ROCE Trend For Shin Maint HoldingsLtd Tell Us?
We like the trends that we're seeing from Shin Maint HoldingsLtd. Over the last five years, returns on capital employed have risen substantially to 40%. The amount of capital employed has increased too, by 28%. So we're very much inspired by what we're seeing at Shin Maint HoldingsLtd thanks to its ability to profitably reinvest capital.
On a separate but related note, it's important to know that Shin Maint HoldingsLtd has a current liabilities to total assets ratio of 55%, which we'd consider pretty high. This can bring about some risks because the company is basically operating with a rather large reliance on its suppliers or other sorts of short-term creditors. While it's not necessarily a bad thing, it can be beneficial if this ratio is lower.
The Key Takeaway
In summary, it's great to see that Shin Maint HoldingsLtd can compound returns by consistently reinvesting capital at increasing rates of return, because these are some of the key ingredients of those highly sought after multi-baggers. Since the stock has returned a staggering 113% to shareholders over the last five years, it looks like investors are recognizing these changes. Therefore, we think it would be worth your time to check if these trends are going to continue.
One more thing, we've spotted 2 warning signs facing Shin Maint HoldingsLtd that you might find interesting.
If you want to search for more stocks that have been earning high returns, check out this free list of stocks with solid balance sheets that are also earning high returns on equity.
New: Manage All Your Stock Portfolios in One Place
We've created the ultimate portfolio companion for stock investors, and it's free.
• Connect an unlimited number of Portfolios and see your total in one currency
• Be alerted to new Warning Signs or Risks via email or mobile
• Track the Fair Value of your stocks
Have feedback on this article? Concerned about the content? Get in touch with us directly. Alternatively, email editorial-team (at) simplywallst.com.
This article by Simply Wall St is general in nature. We provide commentary based on historical data and analyst forecasts only using an unbiased methodology and our articles are not intended to be financial advice. It does not constitute a recommendation to buy or sell any stock, and does not take account of your objectives, or your financial situation. We aim to bring you long-term focused analysis driven by fundamental data. Note that our analysis may not factor in the latest price-sensitive company announcements or qualitative material. Simply Wall St has no position in any stocks mentioned.
About TSE:6086
Outstanding track record with flawless balance sheet.
Market Insights

Advertisement
Community Narratives
The Next Phase of Energy Storage: How NeoVolta Is Tackling America’s Power Crunch
Fair Value US$7.50|35.1% undervalued
MA
Community Contributor
Why EnSilica is Worth Possibly 13x its Current Price
Fair Value UK£5.00|89.8% undervalued
DO
Community Contributor
M&A Activity, Industry Diversification & A Defense Contract Monopoly Will Push BWXT For Healthy Long-Term Growth
Fair Value US$220.00|15.2% undervalued
CL
Community Contributor
A case for Cassiar Gold Corp (TSXV: GLDC) to reach CAD$8-10 before 2030 (X30-37)
Fair Value CA$10.00|96.0% undervalued
AG
Community Contributor