- Japan
- /
- Commercial Services
- /
- TSE:6044
Sanki Service Corporation (TSE:6044) Stock's 27% Dive Might Signal An Opportunity But It Requires Some Scrutiny


To the annoyance of some shareholders, Sanki Service Corporation (TSE:6044) shares are down a considerable 27% in the last month, which continues a horrid run for the company. The drop over the last 30 days has capped off a tough year for shareholders, with the share price down 22% in that time.
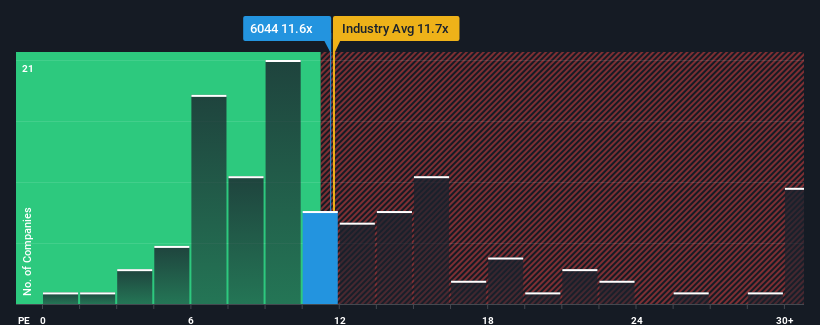
Even after such a large drop in price, you could still be forgiven for feeling indifferent about Sanki Service's P/E ratio of 11.6x, since the median price-to-earnings (or "P/E") ratio in Japan is also close to 13x. However, investors might be overlooking a clear opportunity or potential setback if there is no rational basis for the P/E.
We'd have to say that with no tangible growth over the last year, Sanki Service's earnings have been unimpressive. One possibility is that the P/E is moderate because investors think this benign earnings growth rate might not be enough to outperform the broader market in the near future. If you like the company, you'd be hoping this isn't the case so that you could potentially pick up some stock while it's not quite in favour.
See our latest analysis for Sanki Service
What Are Growth Metrics Telling Us About The P/E?
There's an inherent assumption that a company should be matching the market for P/E ratios like Sanki Service's to be considered reasonable.
Retrospectively, the last year delivered virtually the same number to the company's bottom line as the year before. However, a few strong years before that means that it was still able to grow EPS by an impressive 146% in total over the last three years. Accordingly, shareholders would have probably welcomed those medium-term rates of earnings growth.
Weighing that recent medium-term earnings trajectory against the broader market's one-year forecast for expansion of 9.8% shows it's noticeably more attractive on an annualised basis.
In light of this, it's curious that Sanki Service's P/E sits in line with the majority of other companies. Apparently some shareholders believe the recent performance is at its limits and have been accepting lower selling prices.
The Key Takeaway
Following Sanki Service's share price tumble, its P/E is now hanging on to the median market P/E. Using the price-to-earnings ratio alone to determine if you should sell your stock isn't sensible, however it can be a practical guide to the company's future prospects.
Our examination of Sanki Service revealed its three-year earnings trends aren't contributing to its P/E as much as we would have predicted, given they look better than current market expectations. There could be some unobserved threats to earnings preventing the P/E ratio from matching this positive performance. It appears some are indeed anticipating earnings instability, because the persistence of these recent medium-term conditions would normally provide a boost to the share price.
Before you take the next step, you should know about the 3 warning signs for Sanki Service that we have uncovered.
Of course, you might find a fantastic investment by looking at a few good candidates. So take a peek at this free list of companies with a strong growth track record, trading on a low P/E.
If you're looking to trade Sanki Service, open an account with the lowest-cost platform trusted by professionals, Interactive Brokers.
With clients in over 200 countries and territories, and access to 160 markets, IBKR lets you trade stocks, options, futures, forex, bonds and funds from a single integrated account.
Enjoy no hidden fees, no account minimums, and FX conversion rates as low as 0.03%, far better than what most brokers offer.
Sponsored ContentNew: Manage All Your Stock Portfolios in One Place
We've created the ultimate portfolio companion for stock investors, and it's free.
• Connect an unlimited number of Portfolios and see your total in one currency
• Be alerted to new Warning Signs or Risks via email or mobile
• Track the Fair Value of your stocks
Have feedback on this article? Concerned about the content? Get in touch with us directly. Alternatively, email editorial-team (at) simplywallst.com.
This article by Simply Wall St is general in nature. We provide commentary based on historical data and analyst forecasts only using an unbiased methodology and our articles are not intended to be financial advice. It does not constitute a recommendation to buy or sell any stock, and does not take account of your objectives, or your financial situation. We aim to bring you long-term focused analysis driven by fundamental data. Note that our analysis may not factor in the latest price-sensitive company announcements or qualitative material. Simply Wall St has no position in any stocks mentioned.
Have feedback on this article? Concerned about the content? Get in touch with us directly. Alternatively, email editorial-team@simplywallst.com
About TSE:6044
Sanki Service
Engages in the provision of design, construction, management, and maintenance services for various equipment in Japan and internationally.
Adequate balance sheet second-rate dividend payer.
Market Insights

Community Narratives

