
Advertisement
- Japan
- /
- Professional Services
- /
- TSE:4490
VisasQ Inc.'s (TSE:4490) Shares Leap 37% Yet They're Still Not Telling The Full Story

VisasQ Inc. (TSE:4490) shares have had a really impressive month, gaining 37% after a shaky period beforehand. Unfortunately, the gains of the last month did little to right the losses of the last year with the stock still down 18% over that time.
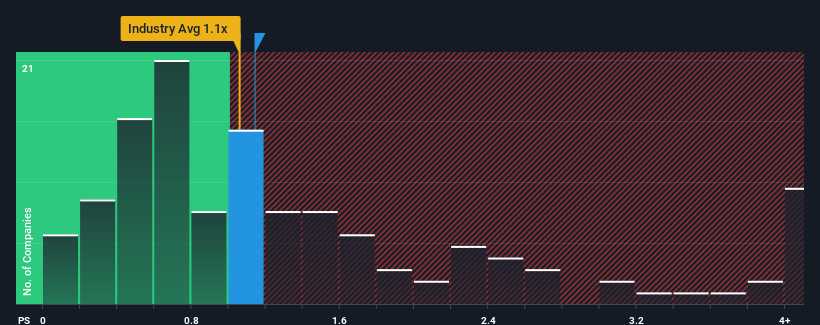
Although its price has surged higher, there still wouldn't be many who think VisasQ's price-to-sales (or "P/S") ratio of 1.1x is worth a mention when it essentially matches the median P/S in Japan's Professional Services industry. However, investors might be overlooking a clear opportunity or potential setback if there is no rational basis for the P/S.
Check out our latest analysis for VisasQ
What Does VisasQ's Recent Performance Look Like?
VisasQ certainly has been doing a good job lately as it's been growing revenue more than most other companies. Perhaps the market is expecting this level of performance to taper off, keeping the P/S from soaring. If not, then existing shareholders have reason to be feeling optimistic about the future direction of the share price.
Keen to find out how analysts think VisasQ's future stacks up against the industry? In that case, our free report is a great place to start.Do Revenue Forecasts Match The P/S Ratio?
In order to justify its P/S ratio, VisasQ would need to produce growth that's similar to the industry.
Retrospectively, the last year delivered a decent 7.0% gain to the company's revenues. Spectacularly, three year revenue growth has ballooned by several orders of magnitude, even though the last 12 months were fairly tame in comparison. Accordingly, shareholders would have been over the moon with those medium-term rates of revenue growth.
Turning to the outlook, the next three years should generate growth of 11% per annum as estimated by the one analyst watching the company. That's shaping up to be materially higher than the 6.7% per year growth forecast for the broader industry.
With this information, we find it interesting that VisasQ is trading at a fairly similar P/S compared to the industry. It may be that most investors aren't convinced the company can achieve future growth expectations.
What We Can Learn From VisasQ's P/S?
Its shares have lifted substantially and now VisasQ's P/S is back within range of the industry median. We'd say the price-to-sales ratio's power isn't primarily as a valuation instrument but rather to gauge current investor sentiment and future expectations.
Despite enticing revenue growth figures that outpace the industry, VisasQ's P/S isn't quite what we'd expect. Perhaps uncertainty in the revenue forecasts are what's keeping the P/S ratio consistent with the rest of the industry. It appears some are indeed anticipating revenue instability, because these conditions should normally provide a boost to the share price.
Plus, you should also learn about these 2 warning signs we've spotted with VisasQ.
If companies with solid past earnings growth is up your alley, you may wish to see this free collection of other companies with strong earnings growth and low P/E ratios.
New: Manage All Your Stock Portfolios in One Place
We've created the ultimate portfolio companion for stock investors, and it's free.
• Connect an unlimited number of Portfolios and see your total in one currency
• Be alerted to new Warning Signs or Risks via email or mobile
• Track the Fair Value of your stocks
Have feedback on this article? Concerned about the content? Get in touch with us directly. Alternatively, email editorial-team (at) simplywallst.com.
This article by Simply Wall St is general in nature. We provide commentary based on historical data and analyst forecasts only using an unbiased methodology and our articles are not intended to be financial advice. It does not constitute a recommendation to buy or sell any stock, and does not take account of your objectives, or your financial situation. We aim to bring you long-term focused analysis driven by fundamental data. Note that our analysis may not factor in the latest price-sensitive company announcements or qualitative material. Simply Wall St has no position in any stocks mentioned.
About TSE:4490
VisasQ
Provides professional knowledge sharing platform/consulting services for business and organizational development in Japan.
Excellent balance sheet with moderate growth potential.
Market Insights

Advertisement
Community Narratives

BMW cruising ahead with new EVs and premium models to boost revenue 5%
Fair Value €135.07|44.5% undervalued
UN
Community Contributor
EU#2 - From Humble Beginnings to Global Powerhouse
Fair Value DKK 851.04|46.1% undervalued
TO
Community Contributor