- Japan
- /
- Professional Services
- /
- TSE:4346
Earnings Not Telling The Story For Nexyz. Group Corporation (TSE:4346) After Shares Rise 29%


Nexyz. Group Corporation (TSE:4346) shareholders would be excited to see that the share price has had a great month, posting a 29% gain and recovering from prior weakness. Unfortunately, the gains of the last month did little to right the losses of the last year with the stock still down 16% over that time.
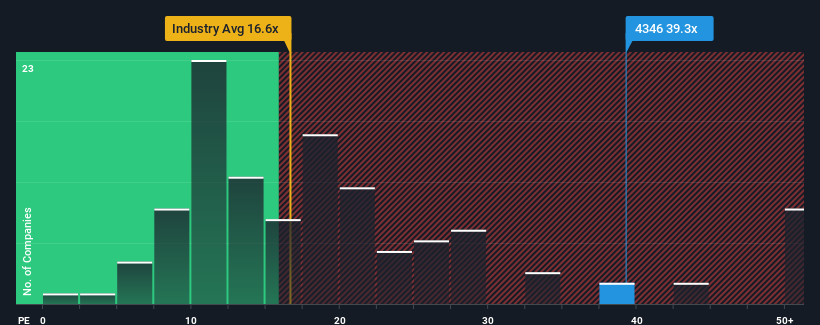
Following the firm bounce in price, Nexyz. Group's price-to-earnings (or "P/E") ratio of 39.3x might make it look like a strong sell right now compared to the market in Japan, where around half of the companies have P/E ratios below 13x and even P/E's below 9x are quite common. However, the P/E might be quite high for a reason and it requires further investigation to determine if it's justified.
For example, consider that Nexyz. Group's financial performance has been poor lately as its earnings have been in decline. One possibility is that the P/E is high because investors think the company will still do enough to outperform the broader market in the near future. If not, then existing shareholders may be quite nervous about the viability of the share price.
View our latest analysis for Nexyz. Group
What Are Growth Metrics Telling Us About The High P/E?
The only time you'd be truly comfortable seeing a P/E as steep as Nexyz. Group's is when the company's growth is on track to outshine the market decidedly.
Taking a look back first, the company's earnings per share growth last year wasn't something to get excited about as it posted a disappointing decline of 50%. Unfortunately, that's brought it right back to where it started three years ago with EPS growth being virtually non-existent overall during that time. So it appears to us that the company has had a mixed result in terms of growing earnings over that time.
Comparing that to the market, which is predicted to deliver 11% growth in the next 12 months, the company's momentum is weaker based on recent medium-term annualised earnings results.
With this information, we find it concerning that Nexyz. Group is trading at a P/E higher than the market. Apparently many investors in the company are way more bullish than recent times would indicate and aren't willing to let go of their stock at any price. There's a good chance existing shareholders are setting themselves up for future disappointment if the P/E falls to levels more in line with recent growth rates.
The Key Takeaway
Shares in Nexyz. Group have built up some good momentum lately, which has really inflated its P/E. We'd say the price-to-earnings ratio's power isn't primarily as a valuation instrument but rather to gauge current investor sentiment and future expectations.
We've established that Nexyz. Group currently trades on a much higher than expected P/E since its recent three-year growth is lower than the wider market forecast. When we see weak earnings with slower than market growth, we suspect the share price is at risk of declining, sending the high P/E lower. Unless the recent medium-term conditions improve markedly, it's very challenging to accept these prices as being reasonable.
And what about other risks? Every company has them, and we've spotted 4 warning signs for Nexyz. Group you should know about.
If these risks are making you reconsider your opinion on Nexyz. Group, explore our interactive list of high quality stocks to get an idea of what else is out there.
Valuation is complex, but we're here to simplify it.
Discover if Nexyz. Group might be undervalued or overvalued with our detailed analysis, featuring fair value estimates, potential risks, dividends, insider trades, and its financial condition.
Access Free AnalysisHave feedback on this article? Concerned about the content? Get in touch with us directly. Alternatively, email editorial-team (at) simplywallst.com.
This article by Simply Wall St is general in nature. We provide commentary based on historical data and analyst forecasts only using an unbiased methodology and our articles are not intended to be financial advice. It does not constitute a recommendation to buy or sell any stock, and does not take account of your objectives, or your financial situation. We aim to bring you long-term focused analysis driven by fundamental data. Note that our analysis may not factor in the latest price-sensitive company announcements or qualitative material. Simply Wall St has no position in any stocks mentioned.
About TSE:4346
Nexyz. Group
Engages in the embedded finance, electronic media, and other activities in Japan.
Adequate balance sheet average dividend payer.
Market Insights

Community Narratives

