- Japan
- /
- Professional Services
- /
- TSE:4194
Market Participants Recognise Visional, Inc.'s (TSE:4194) Earnings Pushing Shares 27% Higher


Visional, Inc. (TSE:4194) shareholders would be excited to see that the share price has had a great month, posting a 27% gain and recovering from prior weakness. Looking further back, the 12% rise over the last twelve months isn't too bad notwithstanding the strength over the last 30 days.
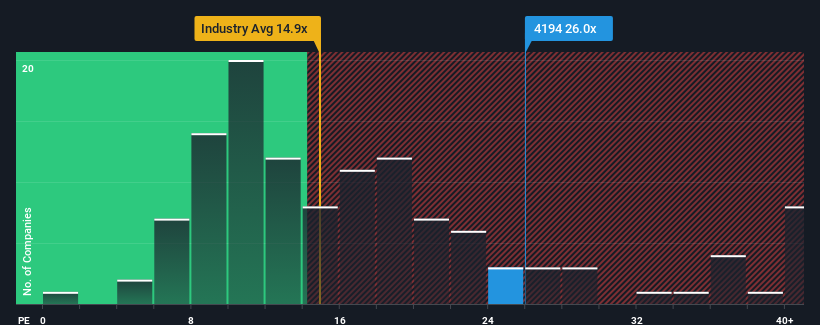
Since its price has surged higher, given close to half the companies in Japan have price-to-earnings ratios (or "P/E's") below 12x, you may consider Visional as a stock to avoid entirely with its 26x P/E ratio. However, the P/E might be quite high for a reason and it requires further investigation to determine if it's justified.
We check all companies for important risks. See what we found for Visional in our free report.Visional could be doing better as it's been growing earnings less than most other companies lately. It might be that many expect the uninspiring earnings performance to recover significantly, which has kept the P/E from collapsing. If not, then existing shareholders may be very nervous about the viability of the share price.
See our latest analysis for Visional
What Are Growth Metrics Telling Us About The High P/E?
Visional's P/E ratio would be typical for a company that's expected to deliver very strong growth, and importantly, perform much better than the market.
Taking a look back first, we see that there was hardly any earnings per share growth to speak of for the company over the past year. However, a few strong years before that means that it was still able to grow EPS by an impressive 272% in total over the last three years. Accordingly, shareholders would have probably welcomed those medium-term rates of earnings growth.
Turning to the outlook, the next three years should generate growth of 17% per year as estimated by the ten analysts watching the company. That's shaping up to be materially higher than the 9.8% each year growth forecast for the broader market.
With this information, we can see why Visional is trading at such a high P/E compared to the market. Apparently shareholders aren't keen to offload something that is potentially eyeing a more prosperous future.
The Key Takeaway
Visional's P/E is flying high just like its stock has during the last month. Generally, our preference is to limit the use of the price-to-earnings ratio to establishing what the market thinks about the overall health of a company.
We've established that Visional maintains its high P/E on the strength of its forecast growth being higher than the wider market, as expected. Right now shareholders are comfortable with the P/E as they are quite confident future earnings aren't under threat. Unless these conditions change, they will continue to provide strong support to the share price.
Many other vital risk factors can be found on the company's balance sheet. Our free balance sheet analysis for Visional with six simple checks will allow you to discover any risks that could be an issue.
If P/E ratios interest you, you may wish to see this free collection of other companies with strong earnings growth and low P/E ratios.
New: Manage All Your Stock Portfolios in One Place
We've created the ultimate portfolio companion for stock investors, and it's free.
• Connect an unlimited number of Portfolios and see your total in one currency
• Be alerted to new Warning Signs or Risks via email or mobile
• Track the Fair Value of your stocks
Have feedback on this article? Concerned about the content? Get in touch with us directly. Alternatively, email editorial-team (at) simplywallst.com.
This article by Simply Wall St is general in nature. We provide commentary based on historical data and analyst forecasts only using an unbiased methodology and our articles are not intended to be financial advice. It does not constitute a recommendation to buy or sell any stock, and does not take account of your objectives, or your financial situation. We aim to bring you long-term focused analysis driven by fundamental data. Note that our analysis may not factor in the latest price-sensitive company announcements or qualitative material. Simply Wall St has no position in any stocks mentioned.
About TSE:4194
Reasonable growth potential with adequate balance sheet.
Market Insights

Community Narratives

