
Advertisement
- Japan
- /
- Professional Services
- /
- TSE:3768
Pinning Down Riskmonster.com's (TSE:3768) P/S Is Difficult Right Now
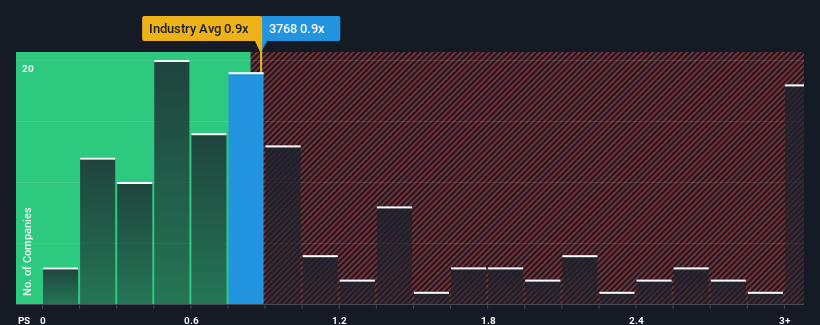
With a median price-to-sales (or "P/S") ratio of close to 0.9x in the Professional Services industry in Japan, you could be forgiven for feeling indifferent about Riskmonster.com's (TSE:3768) P/S ratio, which comes in at about the same. While this might not raise any eyebrows, if the P/S ratio is not justified investors could be missing out on a potential opportunity or ignoring looming disappointment.
Our free stock report includes 3 warning signs investors should be aware of before investing in Riskmonster.com. Read for free now.Check out our latest analysis for Riskmonster.com
What Does Riskmonster.com's Recent Performance Look Like?
For example, consider that Riskmonster.com's financial performance has been pretty ordinary lately as revenue growth is non-existent. Perhaps the market believes the recent run-of-the-mill revenue performance isn't enough to outperform the industry, which has kept the P/S muted. If not, then existing shareholders may be feeling hopeful about the future direction of the share price.
Although there are no analyst estimates available for Riskmonster.com, take a look at this free data-rich visualisation to see how the company stacks up on earnings, revenue and cash flow.What Are Revenue Growth Metrics Telling Us About The P/S?
There's an inherent assumption that a company should be matching the industry for P/S ratios like Riskmonster.com's to be considered reasonable.
Retrospectively, the last year delivered virtually the same number to the company's top line as the year before. The longer-term trend has been no better as the company has no revenue growth to show for over the last three years either. Accordingly, shareholders probably wouldn't have been satisfied with the complete absence of medium-term growth.
Comparing the recent medium-term revenue trends against the industry's one-year growth forecast of 7.7% shows it's noticeably less attractive.
With this information, we find it interesting that Riskmonster.com is trading at a fairly similar P/S compared to the industry. It seems most investors are ignoring the fairly limited recent growth rates and are willing to pay up for exposure to the stock. They may be setting themselves up for future disappointment if the P/S falls to levels more in line with recent growth rates.
What We Can Learn From Riskmonster.com's P/S?
Using the price-to-sales ratio alone to determine if you should sell your stock isn't sensible, however it can be a practical guide to the company's future prospects.
We've established that Riskmonster.com's average P/S is a bit surprising since its recent three-year growth is lower than the wider industry forecast. Right now we are uncomfortable with the P/S as this revenue performance isn't likely to support a more positive sentiment for long. Unless the recent medium-term conditions improve, it's hard to accept the current share price as fair value.
And what about other risks? Every company has them, and we've spotted 3 warning signs for Riskmonster.com (of which 2 don't sit too well with us!) you should know about.
It's important to make sure you look for a great company, not just the first idea you come across. So if growing profitability aligns with your idea of a great company, take a peek at this free list of interesting companies with strong recent earnings growth (and a low P/E).
New: AI Stock Screener & Alerts
Our new AI Stock Screener scans the market every day to uncover opportunities.
• Dividend Powerhouses (3%+ Yield)
• Undervalued Small Caps with Insider Buying
• High growth Tech and AI Companies
Or build your own from over 50 metrics.
Have feedback on this article? Concerned about the content? Get in touch with us directly. Alternatively, email editorial-team (at) simplywallst.com.
This article by Simply Wall St is general in nature. We provide commentary based on historical data and analyst forecasts only using an unbiased methodology and our articles are not intended to be financial advice. It does not constitute a recommendation to buy or sell any stock, and does not take account of your objectives, or your financial situation. We aim to bring you long-term focused analysis driven by fundamental data. Note that our analysis may not factor in the latest price-sensitive company announcements or qualitative material. Simply Wall St has no position in any stocks mentioned.
About TSE:3768
Riskmonster.com
Provides credit management and ASP cloud services in Japan.
Flawless balance sheet established dividend payer.
Market Insights

Advertisement
Community Narratives
MicroVision will explode future revenue by 380.37% with a vision towards success
Fair Value US$60.00|98.4% undervalued
TH
Community Contributor
The Indispensable Artery for a New North American Economy
Fair Value CA$132.87|1.3% undervalued
TI
Community Contributor