
Advertisement
- Japan
- /
- Commercial Services
- /
- TSE:3267
Phil Company,Inc.'s (TSE:3267) Stock Retreats 29% But Revenues Haven't Escaped The Attention Of Investors

The Phil Company,Inc. (TSE:3267) share price has fared very poorly over the last month, falling by a substantial 29%. Instead of being rewarded, shareholders who have already held through the last twelve months are now sitting on a 35% share price drop.
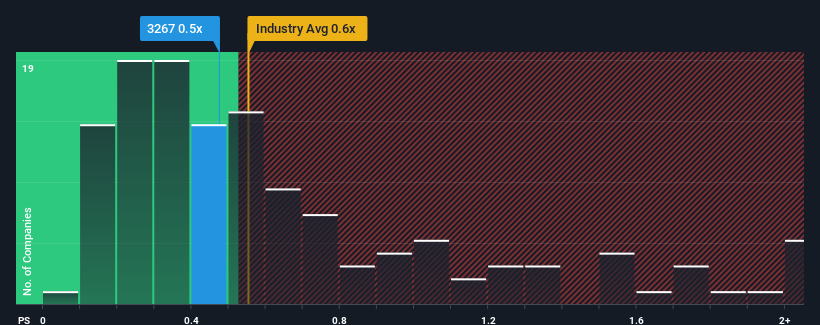
In spite of the heavy fall in price, it's still not a stretch to say that Phil CompanyInc's price-to-sales (or "P/S") ratio of 0.5x right now seems quite "middle-of-the-road" compared to the Commercial Services industry in Japan, where the median P/S ratio is around 0.6x. However, investors might be overlooking a clear opportunity or potential setback if there is no rational basis for the P/S.
View our latest analysis for Phil CompanyInc
How Has Phil CompanyInc Performed Recently?
The revenue growth achieved at Phil CompanyInc over the last year would be more than acceptable for most companies. It might be that many expect the respectable revenue performance to wane, which has kept the P/S from rising. If you like the company, you'd be hoping this isn't the case so that you could potentially pick up some stock while it's not quite in favour.
We don't have analyst forecasts, but you can see how recent trends are setting up the company for the future by checking out our free report on Phil CompanyInc's earnings, revenue and cash flow.What Are Revenue Growth Metrics Telling Us About The P/S?
The only time you'd be comfortable seeing a P/S like Phil CompanyInc's is when the company's growth is tracking the industry closely.
If we review the last year of revenue growth, the company posted a worthy increase of 12%. The solid recent performance means it was also able to grow revenue by 8.4% in total over the last three years. Therefore, it's fair to say the revenue growth recently has been respectable for the company.
Weighing that recent medium-term revenue trajectory against the broader industry's one-year forecast for expansion of 4.2% shows it's about the same on an annualised basis.
With this in consideration, it's clear to see why Phil CompanyInc's P/S matches up closely to its industry peers. It seems most investors are expecting to see average growth rates continue into the future and are only willing to pay a moderate amount for the stock.
The Key Takeaway
Following Phil CompanyInc's share price tumble, its P/S is just clinging on to the industry median P/S. Using the price-to-sales ratio alone to determine if you should sell your stock isn't sensible, however it can be a practical guide to the company's future prospects.
As we've seen, Phil CompanyInc's three-year revenue trends seem to be contributing to its P/S, given they look similar to current industry expectations. With previous revenue trends that keep up with the current industry outlook, it's hard to justify the company's P/S ratio deviating much from it's current point. If recent medium-term revenue trends continue, it's hard to see the share price moving strongly in either direction in the near future under these circumstances.
There are also other vital risk factors to consider and we've discovered 5 warning signs for Phil CompanyInc (3 are concerning!) that you should be aware of before investing here.
If strong companies turning a profit tickle your fancy, then you'll want to check out this free list of interesting companies that trade on a low P/E (but have proven they can grow earnings).
New: Manage All Your Stock Portfolios in One Place
We've created the ultimate portfolio companion for stock investors, and it's free.
• Connect an unlimited number of Portfolios and see your total in one currency
• Be alerted to new Warning Signs or Risks via email or mobile
• Track the Fair Value of your stocks
Have feedback on this article? Concerned about the content? Get in touch with us directly. Alternatively, email editorial-team (at) simplywallst.com.
This article by Simply Wall St is general in nature. We provide commentary based on historical data and analyst forecasts only using an unbiased methodology and our articles are not intended to be financial advice. It does not constitute a recommendation to buy or sell any stock, and does not take account of your objectives, or your financial situation. We aim to bring you long-term focused analysis driven by fundamental data. Note that our analysis may not factor in the latest price-sensitive company announcements or qualitative material. Simply Wall St has no position in any stocks mentioned.
Have feedback on this article? Concerned about the content? Get in touch with us directly. Alternatively, email editorial-team@simplywallst.com
About TSE:3267
Excellent balance sheet and good value.
Market Insights

Advertisement
Community Narratives
Groundbreaking therapies that could change the treatment landscape for PTSD, fibromyalgia, MS & Alzheimer’s
Fair Value US$6.20|86.9% undervalued
CM
Community Contributor
DigitalOcean Will Grow 14% by Embracing AI with Paperspace Acquisition
Fair Value US$50.00|42.8% undervalued
NE
Community Contributor
Viant Technology: A Rising AdTech Challenger in the AI-Powered CTV Market
Fair Value US$38.61|66.0% undervalued
BL
Community Contributor
Volvo will Accelerate Forward into Electric and Autonomous Leadership in Five Years
Fair Value SEK 438.80|40.8% undervalued
UN
Community Contributor