- Japan
- /
- Commercial Services
- /
- TSE:3267
Phil Company,Inc.'s (TSE:3267) Shares Leap 30% Yet They're Still Not Telling The Full Story


Phil Company,Inc. (TSE:3267) shareholders would be excited to see that the share price has had a great month, posting a 30% gain and recovering from prior weakness. Taking a wider view, although not as strong as the last month, the full year gain of 17% is also fairly reasonable.
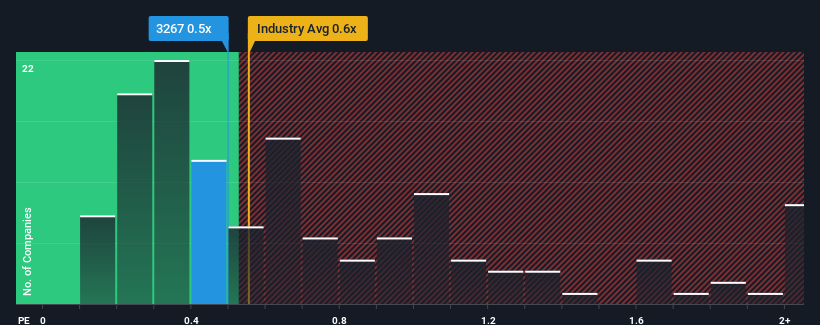
Even after such a large jump in price, there still wouldn't be many who think Phil CompanyInc's price-to-sales (or "P/S") ratio of 0.5x is worth a mention when the median P/S in Japan's Commercial Services industry is similar at about 0.6x. However, investors might be overlooking a clear opportunity or potential setback if there is no rational basis for the P/S.
View our latest analysis for Phil CompanyInc
What Does Phil CompanyInc's Recent Performance Look Like?
Phil CompanyInc certainly has been doing a great job lately as it's been growing its revenue at a really rapid pace. It might be that many expect the strong revenue performance to wane, which has kept the share price, and thus the P/S ratio, from rising. If that doesn't eventuate, then existing shareholders have reason to be feeling optimistic about the future direction of the share price.
We don't have analyst forecasts, but you can see how recent trends are setting up the company for the future by checking out our free report on Phil CompanyInc's earnings, revenue and cash flow.How Is Phil CompanyInc's Revenue Growth Trending?
The only time you'd be comfortable seeing a P/S like Phil CompanyInc's is when the company's growth is tracking the industry closely.
Taking a look back first, we see that the company grew revenue by an impressive 43% last year. Pleasingly, revenue has also lifted 42% in aggregate from three years ago, thanks to the last 12 months of growth. Accordingly, shareholders would have definitely welcomed those medium-term rates of revenue growth.
When compared to the industry's one-year growth forecast of 5.3%, the most recent medium-term revenue trajectory is noticeably more alluring
In light of this, it's curious that Phil CompanyInc's P/S sits in line with the majority of other companies. It may be that most investors are not convinced the company can maintain its recent growth rates.
The Final Word
Its shares have lifted substantially and now Phil CompanyInc's P/S is back within range of the industry median. It's argued the price-to-sales ratio is an inferior measure of value within certain industries, but it can be a powerful business sentiment indicator.
We didn't quite envision Phil CompanyInc's P/S sitting in line with the wider industry, considering the revenue growth over the last three-year is higher than the current industry outlook. It'd be fair to assume that potential risks the company faces could be the contributing factor to the lower than expected P/S. While recent revenue trends over the past medium-term suggest that the risk of a price decline is low, investors appear to see the likelihood of revenue fluctuations in the future.
Before you settle on your opinion, we've discovered 3 warning signs for Phil CompanyInc (1 makes us a bit uncomfortable!) that you should be aware of.
If strong companies turning a profit tickle your fancy, then you'll want to check out this free list of interesting companies that trade on a low P/E (but have proven they can grow earnings).
If you're looking to trade Phil CompanyInc, open an account with the lowest-cost platform trusted by professionals, Interactive Brokers.
With clients in over 200 countries and territories, and access to 160 markets, IBKR lets you trade stocks, options, futures, forex, bonds and funds from a single integrated account.
Enjoy no hidden fees, no account minimums, and FX conversion rates as low as 0.03%, far better than what most brokers offer.
Sponsored ContentNew: Manage All Your Stock Portfolios in One Place
We've created the ultimate portfolio companion for stock investors, and it's free.
• Connect an unlimited number of Portfolios and see your total in one currency
• Be alerted to new Warning Signs or Risks via email or mobile
• Track the Fair Value of your stocks
Have feedback on this article? Concerned about the content? Get in touch with us directly. Alternatively, email editorial-team (at) simplywallst.com.
This article by Simply Wall St is general in nature. We provide commentary based on historical data and analyst forecasts only using an unbiased methodology and our articles are not intended to be financial advice. It does not constitute a recommendation to buy or sell any stock, and does not take account of your objectives, or your financial situation. We aim to bring you long-term focused analysis driven by fundamental data. Note that our analysis may not factor in the latest price-sensitive company announcements or qualitative material. Simply Wall St has no position in any stocks mentioned.
About TSE:3267
Excellent balance sheet and good value.
Market Insights

Community Narratives

