
Advertisement
- Japan
- /
- Professional Services
- /
- TSE:2163
Artner Co.,Ltd. (TSE:2163) Might Not Be As Mispriced As It Looks After Plunging 28%
Artner Co.,Ltd. (TSE:2163) shareholders that were waiting for something to happen have been dealt a blow with a 28% share price drop in the last month. The drop over the last 30 days has capped off a tough year for shareholders, with the share price down 14% in that time.
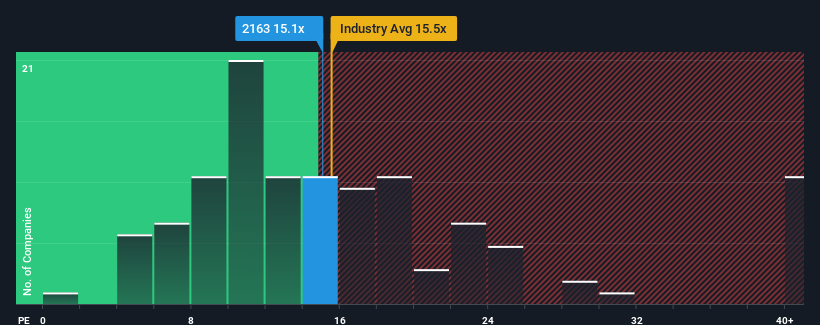
In spite of the heavy fall in price, you could still be forgiven for feeling indifferent about ArtnerLtd's P/E ratio of 15.1x, since the median price-to-earnings (or "P/E") ratio in Japan is also close to 13x. Although, it's not wise to simply ignore the P/E without explanation as investors may be disregarding a distinct opportunity or a costly mistake.
Earnings have risen firmly for ArtnerLtd recently, which is pleasing to see. It might be that many expect the respectable earnings performance to wane, which has kept the P/E from rising. If you like the company, you'd be hoping this isn't the case so that you could potentially pick up some stock while it's not quite in favour.
See our latest analysis for ArtnerLtd
Is There Some Growth For ArtnerLtd?
ArtnerLtd's P/E ratio would be typical for a company that's only expected to deliver moderate growth, and importantly, perform in line with the market.
Taking a look back first, we see that the company managed to grow earnings per share by a handy 8.6% last year. This was backed up an excellent period prior to see EPS up by 57% in total over the last three years. Accordingly, shareholders would have probably welcomed those medium-term rates of earnings growth.
Weighing that recent medium-term earnings trajectory against the broader market's one-year forecast for expansion of 9.8% shows it's noticeably more attractive on an annualised basis.
In light of this, it's curious that ArtnerLtd's P/E sits in line with the majority of other companies. It may be that most investors are not convinced the company can maintain its recent growth rates.
The Final Word
Following ArtnerLtd's share price tumble, its P/E is now hanging on to the median market P/E. Typically, we'd caution against reading too much into price-to-earnings ratios when settling on investment decisions, though it can reveal plenty about what other market participants think about the company.
We've established that ArtnerLtd currently trades on a lower than expected P/E since its recent three-year growth is higher than the wider market forecast. There could be some unobserved threats to earnings preventing the P/E ratio from matching this positive performance. At least the risk of a price drop looks to be subdued if recent medium-term earnings trends continue, but investors seem to think future earnings could see some volatility.
Don't forget that there may be other risks. For instance, we've identified 1 warning sign for ArtnerLtd that you should be aware of.
Of course, you might find a fantastic investment by looking at a few good candidates. So take a peek at this free list of companies with a strong growth track record, trading on a low P/E.
New: Manage All Your Stock Portfolios in One Place
We've created the ultimate portfolio companion for stock investors, and it's free.
• Connect an unlimited number of Portfolios and see your total in one currency
• Be alerted to new Warning Signs or Risks via email or mobile
• Track the Fair Value of your stocks
Have feedback on this article? Concerned about the content? Get in touch with us directly. Alternatively, email editorial-team (at) simplywallst.com.
This article by Simply Wall St is general in nature. We provide commentary based on historical data and analyst forecasts only using an unbiased methodology and our articles are not intended to be financial advice. It does not constitute a recommendation to buy or sell any stock, and does not take account of your objectives, or your financial situation. We aim to bring you long-term focused analysis driven by fundamental data. Note that our analysis may not factor in the latest price-sensitive company announcements or qualitative material. Simply Wall St has no position in any stocks mentioned.
Have feedback on this article? Concerned about the content? Get in touch with us directly. Alternatively, email editorial-team@simplywallst.com
About TSE:2163
Artner
Engages in the engineer dispatching and contracting businesses in Japan and internationally.
Outstanding track record with flawless balance sheet and pays a dividend.
Market Insights

Advertisement
Community Narratives
The Next Phase of Energy Storage: How NeoVolta Is Tackling America’s Power Crunch
Fair Value US$7.50|35.1% undervalued
MA
Community Contributor
Why EnSilica is Worth Possibly 13x its Current Price
Fair Value UK£5.00|89.8% undervalued
DO
Community Contributor
M&A Activity, Industry Diversification & A Defense Contract Monopoly Will Push BWXT For Healthy Long-Term Growth
Fair Value US$220.00|15.2% undervalued
CL
Community Contributor
A case for Cassiar Gold Corp (TSXV: GLDC) to reach CAD$8-10 before 2030 (X30-37)
Fair Value CA$10.00|96.0% undervalued
AG
Community Contributor