
Advertisement
- Japan
- /
- Professional Services
- /
- TSE:2146
We Think That There Are Some Issues For UT GroupLtd (TSE:2146) Beyond Its Promising Earnings
UT Group Co.,Ltd.'s (TSE:2146 ) stock didn't jump after it announced some healthy earnings. We did some digging and believe investors may be worried about some underlying factors in the report.
See our latest analysis for UT GroupLtd
A Closer Look At UT GroupLtd's Earnings
Many investors haven't heard of the accrual ratio from cashflow, but it is actually a useful measure of how well a company's profit is backed up by free cash flow (FCF) during a given period. In plain english, this ratio subtracts FCF from net profit, and divides that number by the company's average operating assets over that period. This ratio tells us how much of a company's profit is not backed by free cashflow.
Therefore, it's actually considered a good thing when a company has a negative accrual ratio, but a bad thing if its accrual ratio is positive. That is not intended to imply we should worry about a positive accrual ratio, but it's worth noting where the accrual ratio is rather high. To quote a 2014 paper by Lewellen and Resutek, "firms with higher accruals tend to be less profitable in the future".
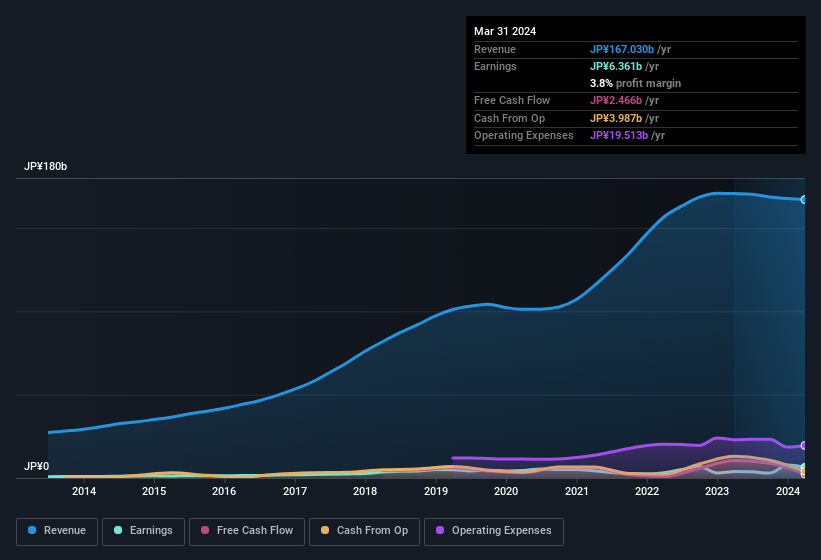
For the year to March 2024, UT GroupLtd had an accrual ratio of 0.25. Unfortunately, that means its free cash flow fell significantly short of its reported profits. Indeed, in the last twelve months it reported free cash flow of JP¥2.5b, which is significantly less than its profit of JP¥6.36b. UT GroupLtd's free cash flow actually declined over the last year, but it may bounce back next year, since free cash flow is often more volatile than accounting profits. The good news for shareholders is that UT GroupLtd's accrual ratio was much better last year, so this year's poor reading might simply be a case of a short term mismatch between profit and FCF. Shareholders should look for improved cashflow relative to profit in the current year, if that is indeed the case.
That might leave you wondering what analysts are forecasting in terms of future profitability. Luckily, you can click here to see an interactive graph depicting future profitability, based on their estimates.
Our Take On UT GroupLtd's Profit Performance
UT GroupLtd didn't convert much of its profit to free cash flow in the last year, which some investors may consider rather suboptimal. Because of this, we think that it may be that UT GroupLtd's statutory profits are better than its underlying earnings power. But at least holders can take some solace from the 51% per annum growth in EPS for the last three. Of course, we've only just scratched the surface when it comes to analysing its earnings; one could also consider margins, forecast growth, and return on investment, among other factors. In light of this, if you'd like to do more analysis on the company, it's vital to be informed of the risks involved. For example, UT GroupLtd has 2 warning signs (and 1 which doesn't sit too well with us) we think you should know about.
This note has only looked at a single factor that sheds light on the nature of UT GroupLtd's profit. But there are plenty of other ways to inform your opinion of a company. Some people consider a high return on equity to be a good sign of a quality business. While it might take a little research on your behalf, you may find this free collection of companies boasting high return on equity, or this list of stocks with significant insider holdings to be useful.
New: AI Stock Screener & Alerts
Our new AI Stock Screener scans the market every day to uncover opportunities.
• Dividend Powerhouses (3%+ Yield)
• Undervalued Small Caps with Insider Buying
• High growth Tech and AI Companies
Or build your own from over 50 metrics.
Have feedback on this article? Concerned about the content? Get in touch with us directly. Alternatively, email editorial-team (at) simplywallst.com.
This article by Simply Wall St is general in nature. We provide commentary based on historical data and analyst forecasts only using an unbiased methodology and our articles are not intended to be financial advice. It does not constitute a recommendation to buy or sell any stock, and does not take account of your objectives, or your financial situation. We aim to bring you long-term focused analysis driven by fundamental data. Note that our analysis may not factor in the latest price-sensitive company announcements or qualitative material. Simply Wall St has no position in any stocks mentioned.
About TSE:2146
UT GroupLtd
Engages in the dispatch and outsourcing of permanent employees in the manufacturing, design and development, construction, and other sectors in Japan.
Flawless balance sheet with moderate growth potential.
Market Insights

Advertisement
Community Narratives
MINISO's fair value is projected at 26.69 with an anticipated PE ratio shift of 20x
Fair Value US$24.03|11.0% undervalued
BE
Community Contributor
Procter & Gamble: A Dividend Giant Facing Slowing Growth
Fair Value US$119.81|23.3% overvalued
AN
Community Contributor
Eli Lilly's Future Growth Driven by Tirzepatide and Favorable Market Conditions
Fair Value US$1.19k|13.8% undervalued
EA
Community Contributor