
Advertisement

As global markets experience a positive shift with cooling inflation and strong bank earnings propelling U.S. stocks higher, investors are increasingly looking towards dividend stocks as a stable income source amidst fluctuating economic conditions. In this environment, identifying solid dividend-paying companies becomes crucial, as they offer the potential for regular income while also providing resilience against market volatility.
Top 10 Dividend Stocks
| Name | Dividend Yield | Dividend Rating |
| Tsubakimoto Chain (TSE:6371) | 4.26% | ★★★★★★ |
| Guaranty Trust Holding (NGSE:GTCO) | 6.04% | ★★★★★★ |
| Peoples Bancorp (NasdaqGS:PEBO) | 4.90% | ★★★★★★ |
| CAC Holdings (TSE:4725) | 4.69% | ★★★★★★ |
| Southside Bancshares (NYSE:SBSI) | 4.54% | ★★★★★★ |
| Yamato Kogyo (TSE:5444) | 4.10% | ★★★★★★ |
| Padma Oil (DSE:PADMAOIL) | 7.48% | ★★★★★★ |
| Guangxi LiuYao Group (SHSE:603368) | 3.45% | ★★★★★★ |
| Premier Financial (NasdaqGS:PFC) | 4.65% | ★★★★★★ |
| Citizens & Northern (NasdaqCM:CZNC) | 5.82% | ★★★★★★ |
Click here to see the full list of 1980 stocks from our Top Dividend Stocks screener.
We'll examine a selection from our screener results.
UT GroupLtd (TSE:2146)
Simply Wall St Dividend Rating: ★★★★☆☆
Overview: UT Group Co., Ltd. operates in Japan, focusing on the dispatch and outsourcing of permanent employees across various sectors such as manufacturing, design and development, and construction, with a market cap of ¥85.35 billion.
Operations: UT Group Co., Ltd.'s revenue is derived from its Area Business (¥66.02 billion), Vietnam Business (¥13.53 billion), Solution Business (¥19.95 billion), and Manufacturing Business excluding the Solution segment (¥64.92 billion).
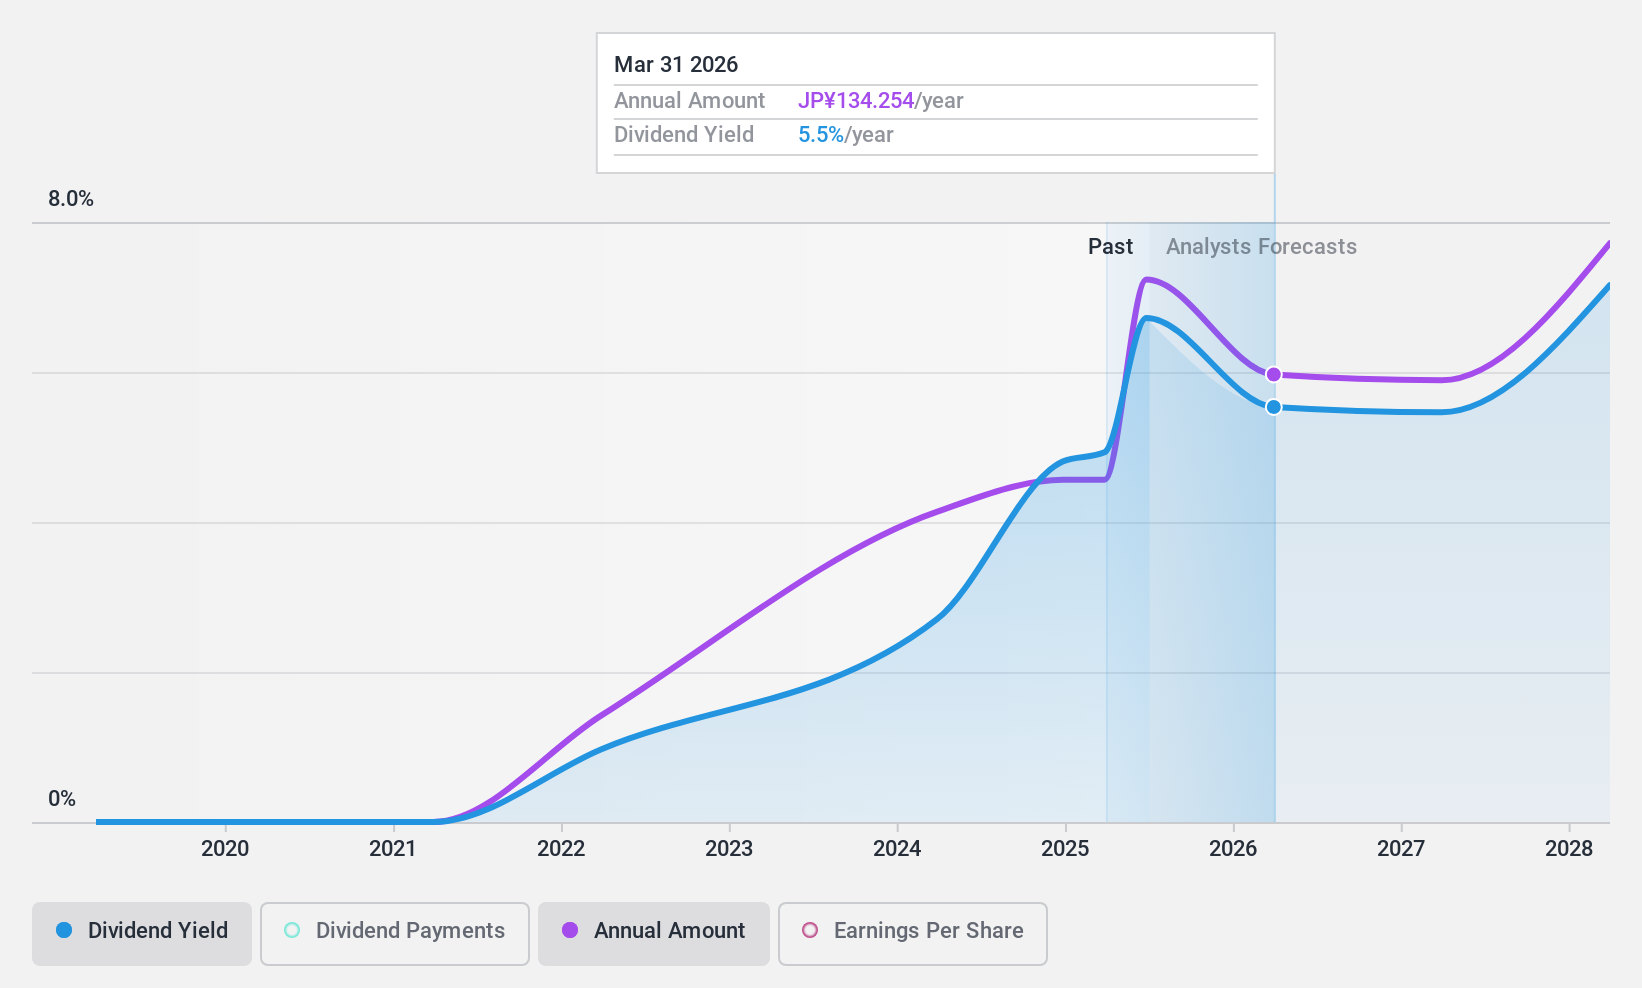
Dividend Yield: 4.7%
UT Group Ltd. faces challenges for dividend investors, with recent guidance lowering profit projections and a revised dividend forecast of ¥102.66 per share from ¥164.81. The company's dividend yield is high at 4.71%, placing it in the top 25% in Japan, yet it's not well covered by free cash flows or earnings due to a cash payout ratio of 103.5%. Additionally, its dividends have been volatile over the past decade despite trading at a good value compared to peers.
- Dive into the specifics of UT GroupLtd here with our thorough dividend report.
- The valuation report we've compiled suggests that UT GroupLtd's current price could be quite moderate.
Takachiho KohekiLtd (TSE:2676)
Simply Wall St Dividend Rating: ★★★★★☆
Overview: Takachiho Koheki Co., Ltd. is an electronics technology trading company based in Japan with a market capitalization of ¥35.89 billion.
Operations: Takachiho Koheki Ltd. generates revenue through its Device segment at ¥12.73 billion, Systems segment at ¥9.97 billion, and Cloud Service & Support segment at ¥3.11 billion.
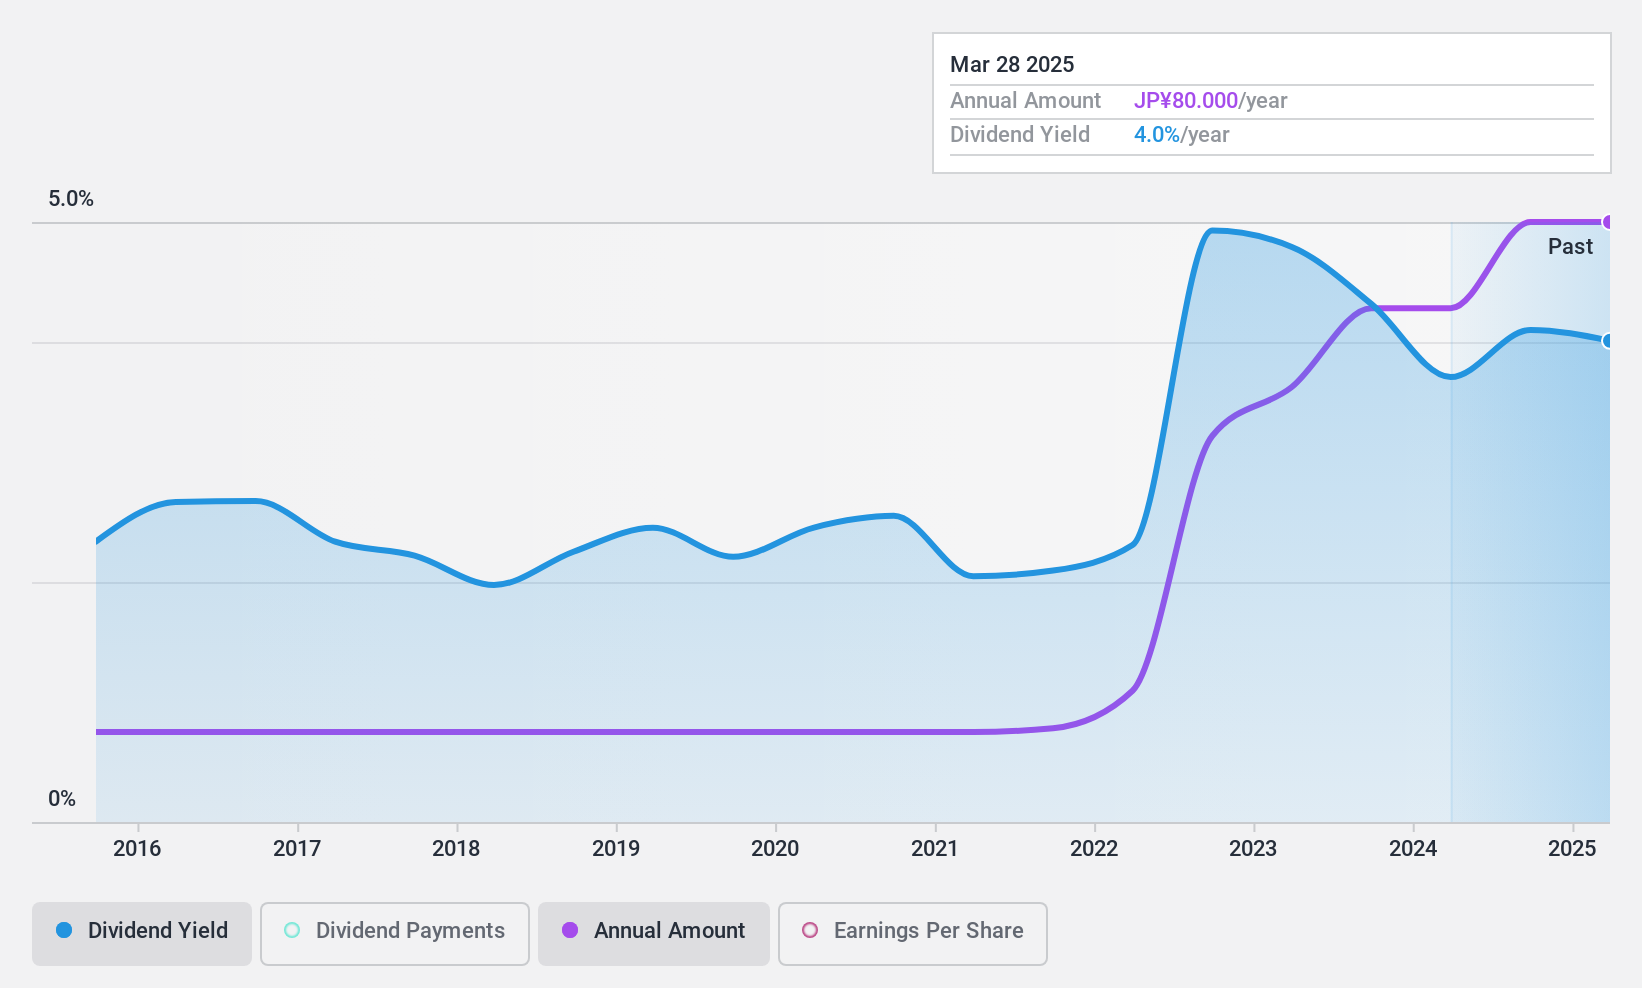
Dividend Yield: 4.2%
Takachiho Koheki Ltd. offers a stable dividend history with consistent growth over the past decade, recently increasing its quarterly dividend to ¥58 per share. However, its high payout ratio of 113% indicates dividends are not well covered by earnings, although they are supported by cash flows with an 82.7% cash payout ratio. The company trades significantly below estimated fair value and maintains a competitive yield within Japan's top 25%. Recent leadership changes could impact future strategy.
- Navigate through the intricacies of Takachiho KohekiLtd with our comprehensive dividend report here.
- Insights from our recent valuation report point to the potential overvaluation of Takachiho KohekiLtd shares in the market.
HIMACS (TSE:4299)
Simply Wall St Dividend Rating: ★★★★★☆
Overview: HIMACS, Ltd. operates in Japan offering defined valued processes for various system lifecycles and has a market cap of ¥15.99 billion.
Operations: HIMACS, Ltd. generates revenue from its Value Solution Services segment, amounting to ¥17.51 billion.
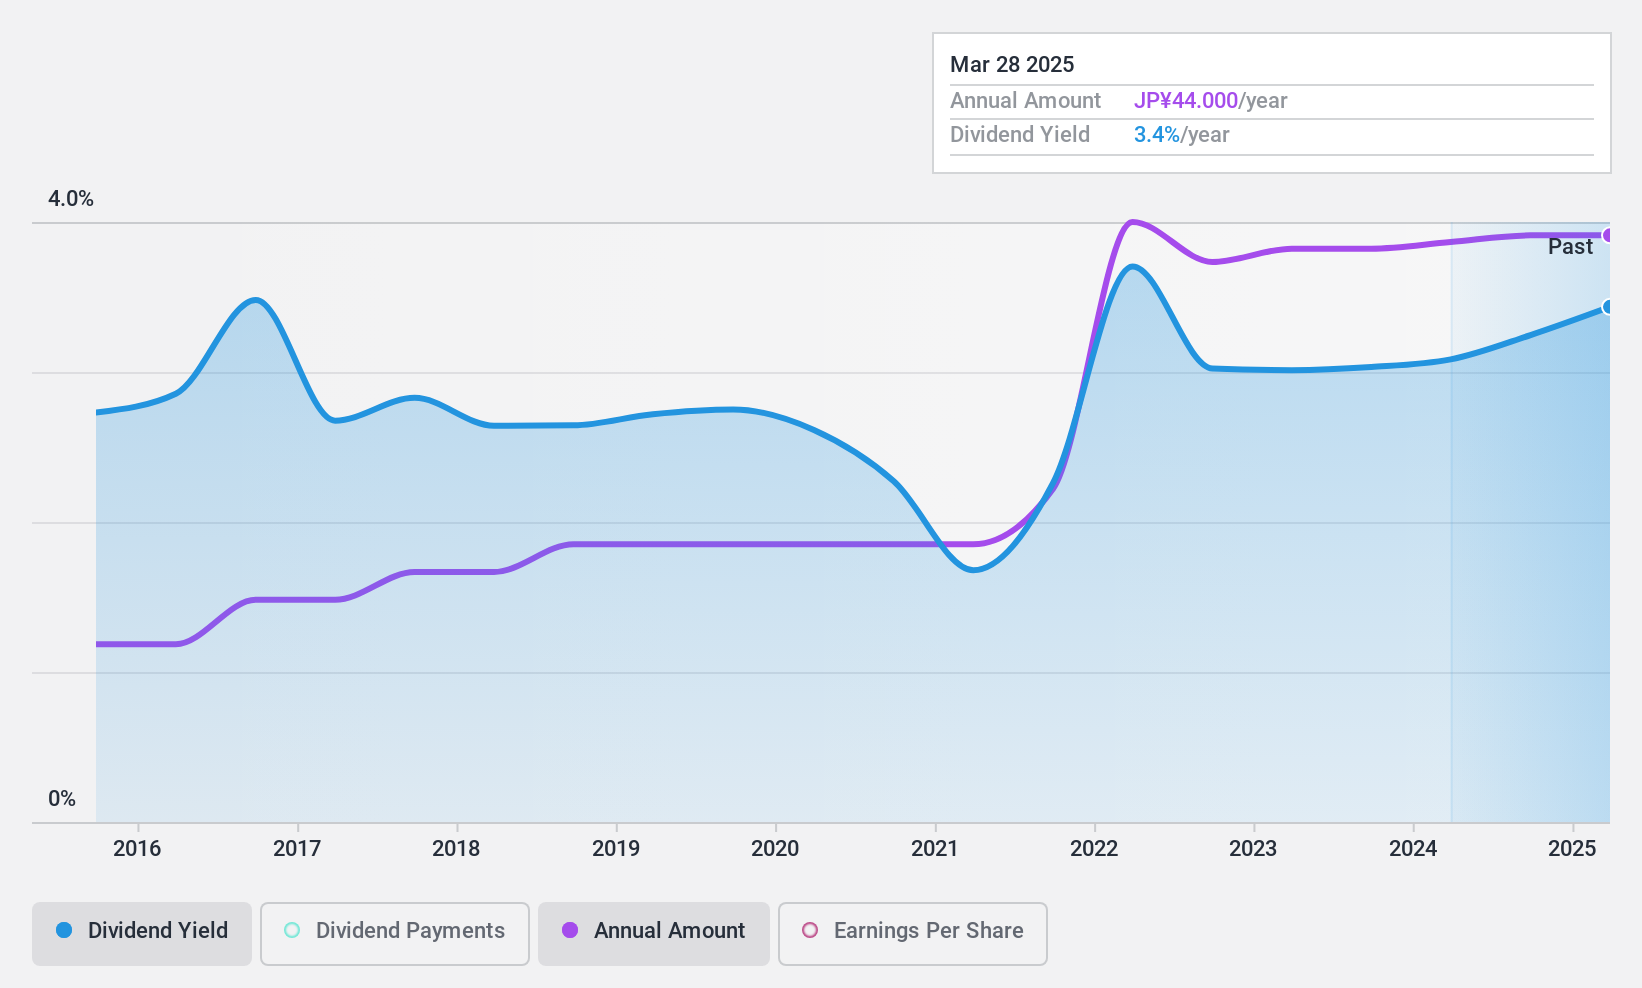
Dividend Yield: 3.2%
HIMACS offers a reliable dividend history with stable payments over the past decade, recently increasing its quarterly dividend to ¥22 per share. The dividends are well covered by earnings and cash flows, with payout ratios of 40.6% and 46.3%, respectively. However, its yield of 3.16% is below Japan’s top tier of dividend payers. The company expects ¥18.6 billion in net sales for fiscal year ending March 2025, indicating potential financial stability moving forward.
- Delve into the full analysis dividend report here for a deeper understanding of HIMACS.
- Our valuation report unveils the possibility HIMACS' shares may be trading at a discount.
Key Takeaways
- Click this link to deep-dive into the 1980 companies within our Top Dividend Stocks screener.
- Are these companies part of your investment strategy? Use Simply Wall St to consolidate your holdings into a portfolio and gain insights with our comprehensive analysis tools.
- Discover a world of investment opportunities with Simply Wall St's free app and access unparalleled stock analysis across all markets.
Seeking Other Investments?
- Explore high-performing small cap companies that haven't yet garnered significant analyst attention.
- Fuel your portfolio with companies showing strong growth potential, backed by optimistic outlooks both from analysts and management.
- Find companies with promising cash flow potential yet trading below their fair value.
This article by Simply Wall St is general in nature. We provide commentary based on historical data and analyst forecasts only using an unbiased methodology and our articles are not intended to be financial advice. It does not constitute a recommendation to buy or sell any stock, and does not take account of your objectives, or your financial situation. We aim to bring you long-term focused analysis driven by fundamental data. Note that our analysis may not factor in the latest price-sensitive company announcements or qualitative material. Simply Wall St has no position in any stocks mentioned.
Valuation is complex, but we're here to simplify it.
Discover if HIMACS might be undervalued or overvalued with our detailed analysis, featuring fair value estimates, potential risks, dividends, insider trades, and its financial condition.
Access Free AnalysisHave feedback on this article? Concerned about the content? Get in touch with us directly. Alternatively, email editorial-team@simplywallst.com
About TSE:4299
HIMACS
Provides defined valued processes for various system lifecycles in Japan.
Flawless balance sheet established dividend payer.
Market Insights


Advertisement
Community Narratives
Suncorp’s Next Chapter: Insurance-Only and Ready to Grow
Fair Value AU$22.83|5.7% undervalued
RO
Community Contributor
Thyssenkrupp Nucera Will Achieve Double-Digit Profits by 2030 Boosted by Hydrogen Growth
Fair Value €14.40|32.5% undervalued
CH
Community Contributor
Tesla’s Nvidia Moment – The AI & Robotics Inflection Point
Fair Value US$384.84|21.9% undervalued
BL
Community Contributor