Advertisement
- Japan
- /
- Trade Distributors
- /
- TSE:8002
Marubeni (TSE:8002): Valuation in Focus After JPMorgan’s Upbeat Initiation and Power Trading Venture

Simply Wall St
Reviewed by Kshitija Bhandaru
JPMorgan’s recent initiation on Marubeni (TSE:8002) comes just as the company unveils a new joint venture in Japan’s power sector. This move demonstrates its ongoing push into strategic growth areas and platform businesses.
See our latest analysis for Marubeni.
Marubeni’s strategic push, highlighted by its latest power trading joint venture and ongoing share buybacks, has improved sentiment among investors eyeing the company’s growth ambitions. While the share price has only nudged higher this year, its 1-year total shareholder return of 0.58% reflects both the momentum of recent initiatives and a steady, longer-term performance that stands out in a competitive market.
If you’re interested in companies that use innovation and scale to outperform, now’s a great time to discover fast growing stocks with high insider ownership
With analyst upgrades and new growth ventures driving optimism, the key question now is whether Marubeni’s current valuation leaves room for upside or if the market is already reflecting its potential for future expansion.
Price-to-Earnings of 12x: Is it justified?
At a price-to-earnings (P/E) ratio of 12x, Marubeni’s shares stand below the Japanese market average and in line with its peer group. With the last close at ¥3,745, the stock appears attractively valued relative to the broader market benchmark but shows a nuanced picture versus industry peers.
The P/E ratio gauges how much investors are willing to pay for each yen of Marubeni’s earnings. For a diversified conglomerate in the capital goods sector, this is a crucial lens, as it encapsulates both current profitability and market growth expectations.
Marubeni’s P/E is lower than the Japanese market average of 14.3x, suggesting the market sees less growth or more risk compared to the broader market. However, compared to the JP Trade Distributors industry (9.8x), Marubeni trades at a slight premium. Market participants might be attributing this to Marubeni’s past earnings growth and quality, yet there is a notable gap versus the estimated Fair Price-to-Earnings Ratio (20.9x), a level the market could eventually reassess toward if the performance and outlook remain firm.
Explore the SWS fair ratio for Marubeni
Result: Price-to-Earnings of 12x (ABOUT RIGHT)
However, subdued annual revenue growth and a recent modest uptick in earnings could temper expectations if operational momentum does not accelerate in the coming quarters.
Find out about the key risks to this Marubeni narrative.
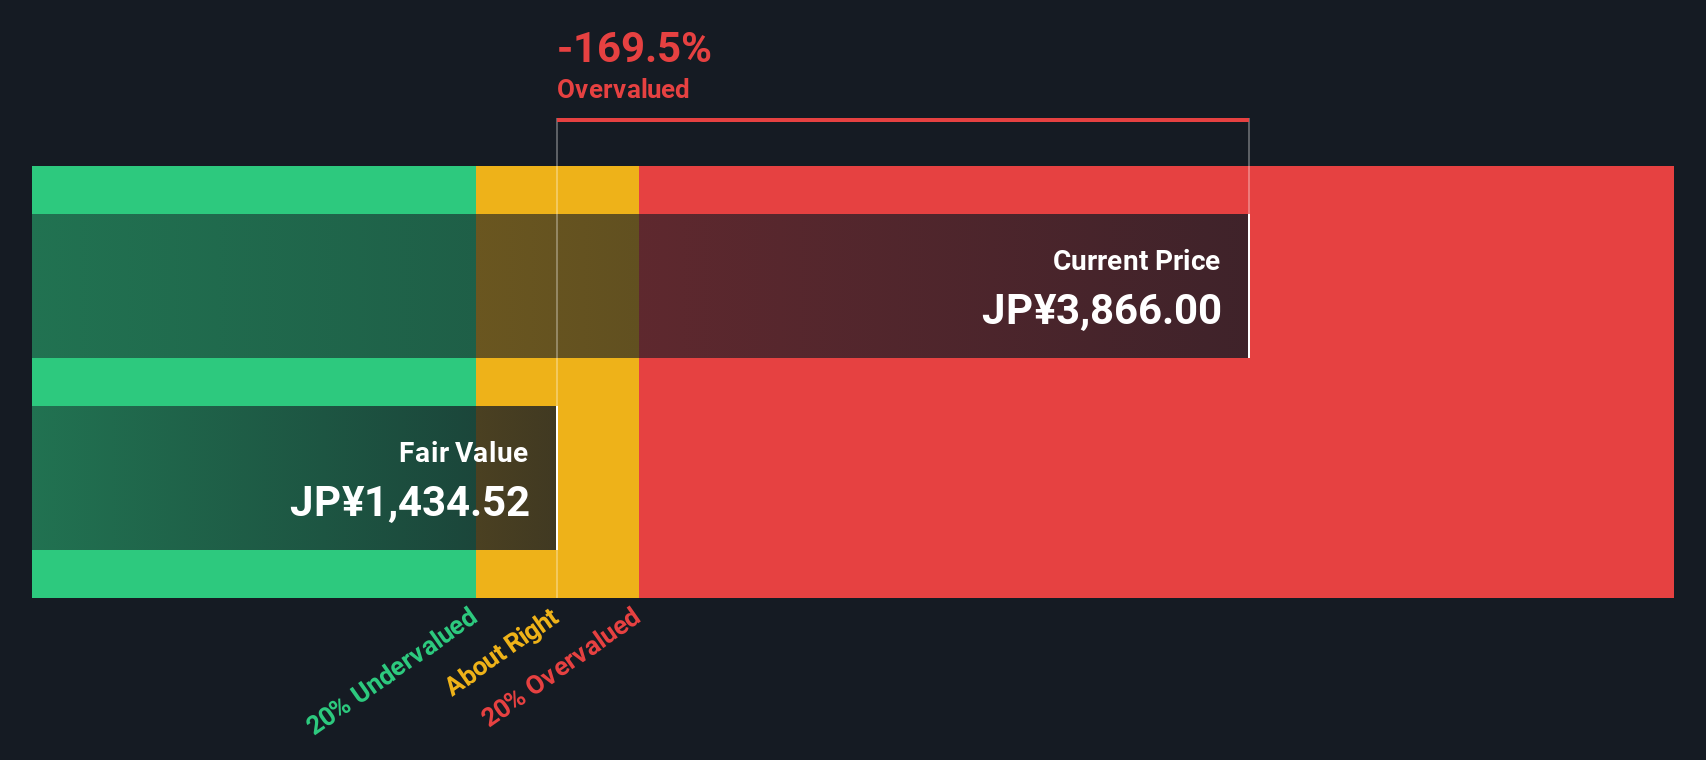
Another View: Our DCF Model’s Perspective
While Marubeni’s current price-to-earnings ratio suggests reasonable value, our SWS DCF model presents a contrasting outlook. According to this approach, Marubeni appears to be trading well above its estimated fair value, indicating that the market price may be factoring in more optimism than fundamentals alone support. Could this mean there is more downside risk than meets the eye?
Look into how the SWS DCF model arrives at its fair value.
Simply Wall St performs a discounted cash flow (DCF) on every stock in the world every day (check out Marubeni for example). We show the entire calculation in full. You can track the result in your watchlist or portfolio and be alerted when this changes, or use our stock screener to discover undervalued stocks based on their cash flows. If you save a screener we even alert you when new companies match - so you never miss a potential opportunity.
Build Your Own Marubeni Narrative
If you have a different perspective or want to reach your own conclusions, you can quickly build a custom view using the same data in just a few minutes, then Do it your way.
A great starting point for your Marubeni research is our analysis highlighting 3 key rewards and 2 important warning signs that could impact your investment decision.
Looking for more investment ideas?
Don’t limit yourself to a single stock when there are standout opportunities waiting just beyond your watchlist. Take action now or risk missing out.
- Tap into the momentum of cutting-edge robotics and automation with these 24 AI penny stocks, which are reshaping entire industries through artificial intelligence breakthroughs.
- Secure steady income streams and financial resilience by checking out these 19 dividend stocks with yields > 3%, offering robust yields above 3%.
- Ride the next tech surge by seeking out these 3561 penny stocks with strong financials, which are positioned for rapid growth and strong financial performance.
This article by Simply Wall St is general in nature. We provide commentary based on historical data and analyst forecasts only using an unbiased methodology and our articles are not intended to be financial advice. It does not constitute a recommendation to buy or sell any stock, and does not take account of your objectives, or your financial situation. We aim to bring you long-term focused analysis driven by fundamental data. Note that our analysis may not factor in the latest price-sensitive company announcements or qualitative material. Simply Wall St has no position in any stocks mentioned.
New: Manage All Your Stock Portfolios in One Place
We've created the ultimate portfolio companion for stock investors, and it's free.
• Connect an unlimited number of Portfolios and see your total in one currency
• Be alerted to new Warning Signs or Risks via email or mobile
• Track the Fair Value of your stocks
Have feedback on this article? Concerned about the content? Get in touch with us directly. Alternatively, email editorial-team@simplywallst.com
About TSE:8002
Marubeni
Marubeni Corporation purchases, distributes, and markets industrial and consumer goods.
Proven track record with adequate balance sheet and pays a dividend.
Similar Companies
Market Insights

Advertisement
Community Narratives
The Next Phase of Energy Storage: How NeoVolta Is Tackling America’s Power Crunch
Fair Value US$7.50|35.1% undervalued
MA
Community Contributor
Why EnSilica is Worth Possibly 13x its Current Price
Fair Value UK£5.00|89.8% undervalued
DO
Community Contributor
M&A Activity, Industry Diversification & A Defense Contract Monopoly Will Push BWXT For Healthy Long-Term Growth
Fair Value US$220.00|15.2% undervalued
CL
Community Contributor
A case for Cassiar Gold Corp (TSXV: GLDC) to reach CAD$8-10 before 2030 (X30-37)
Fair Value CA$10.00|96.0% undervalued
AG
Community Contributor