Advertisement
- Japan
- /
- Trade Distributors
- /
- TSE:8002
Does Marubeni’s Stock Rally Signal Room to Run After the Nikkei 225 Rebalance in 2025?

Simply Wall St
Reviewed by Bailey Pemberton
If you have been tracking Marubeni’s stock recently, chances are you have asked yourself if now is the right time to buy in or cash out. With a last close at 3,866, and a jaw-dropping 691.7% return over five years, it is hard not to be impressed, even for seasoned investors. Just in the last week, shares jumped 6.7%, building on a month-long rally of 11.5%. Year-to-date, the surge is a stunning 63% and, over the past year, 58.7%. These numbers are not just eye-catching; they continue to spark debates over how much of this momentum is due to long-term fundamental strength versus changes in the market's perception of risk and opportunity surrounding Japanese trading houses.
Recent global supply chain shifts and renewed attention on the resources sector have been fueling Marubeni’s narrative as an enabler of global trade resilience. These developments, combined with a generally risk-on mood among investors, appear to be driving Marubeni’s notable returns and suggest a shift in how the market values its diversified business lines.
But is Marubeni undervalued, or is this just enthusiasm running ahead of reality? Based on six commonly used valuation checks, Marubeni passes two, which gives it a value score of 2 out of 6. This result indicates both potential and caution for would-be investors. Next, we will break down how each of these valuation approaches frames Marubeni's price, and why there might be an even more insightful way to look at its true worth later in the article.
Marubeni scores just 2/6 on our valuation checks. See what other red flags we found in the full valuation breakdown.
Approach 1: Marubeni Discounted Cash Flow (DCF) Analysis
The Discounted Cash Flow (DCF) model estimates a company’s intrinsic value by projecting future cash flows and discounting them back to today’s value using a required rate of return. In Marubeni’s case, analysts have provided cash flow estimates for the next five years, with subsequent years extrapolated based on historical and expected trends.
Marubeni’s current Free Cash Flow (FCF) stands at approximately ¥355 billion. Looking ahead, analysts forecast FCF to reach ¥140 billion by the fiscal year ending March 2030. Over the next decade, projected annual cash flows show some fluctuations but generally indicate sustained performance in the hundreds of billions of yen. Estimates beyond analyst coverage, extended by Simply Wall St, provide further perspective on Marubeni’s long-term cash-generating ability.
After discounting these future cash flows back to their present value, the DCF valuation for Marubeni arrives at an intrinsic fair value of ¥1,434 per share. With shares currently trading at ¥3,866, this implies the stock is trading at a 169.5% premium to its intrinsic value according to this model.
Result: OVERVALUED
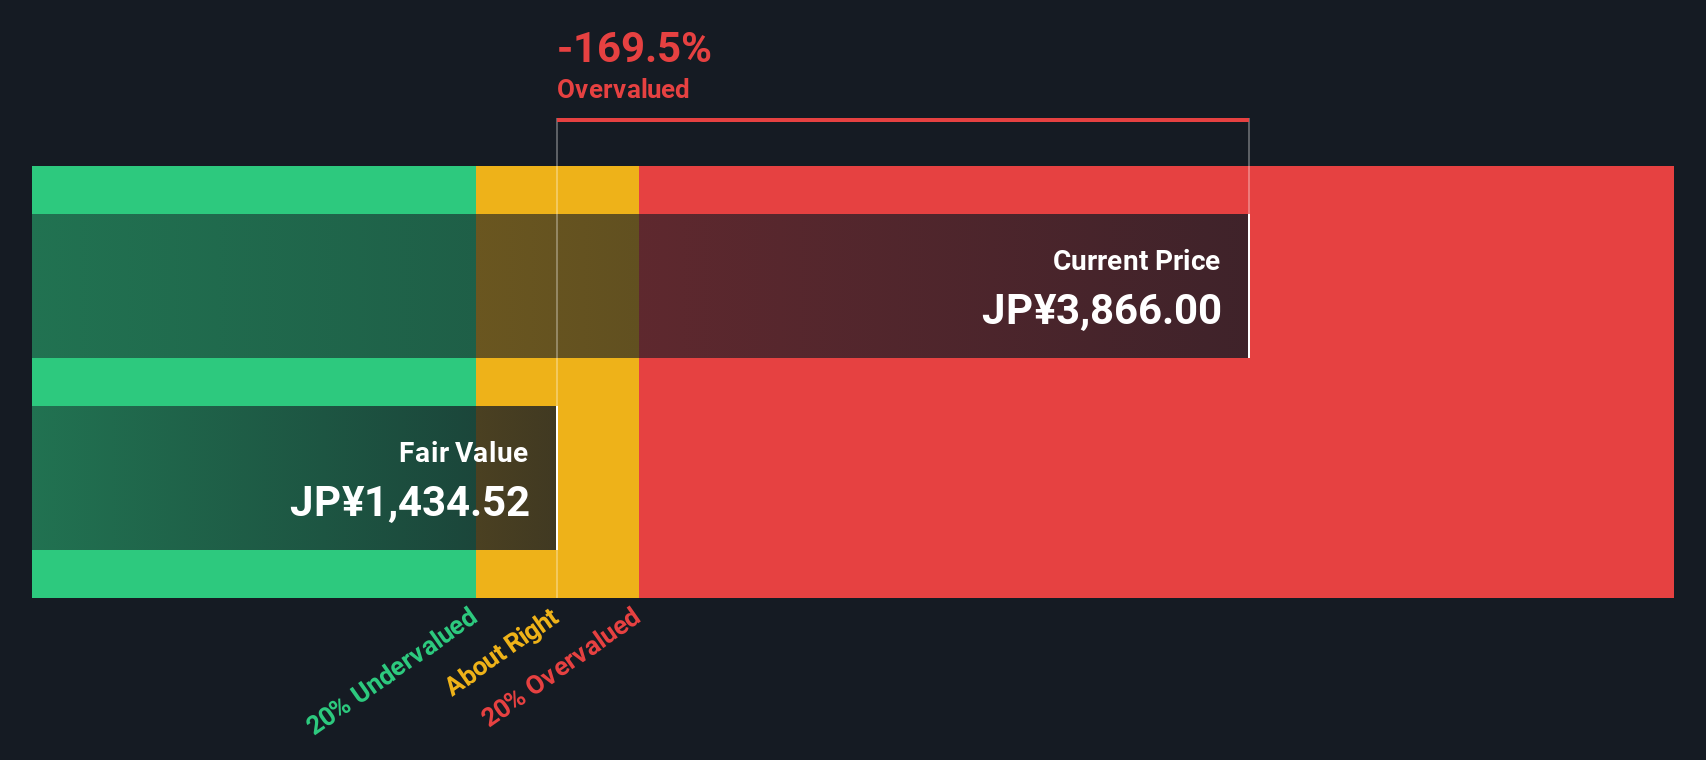
Our Discounted Cash Flow (DCF) analysis suggests Marubeni may be overvalued by 169.5%. Find undervalued stocks or create your own screener to find better value opportunities.
Approach 2: Marubeni Price vs Earnings (PE Ratio)
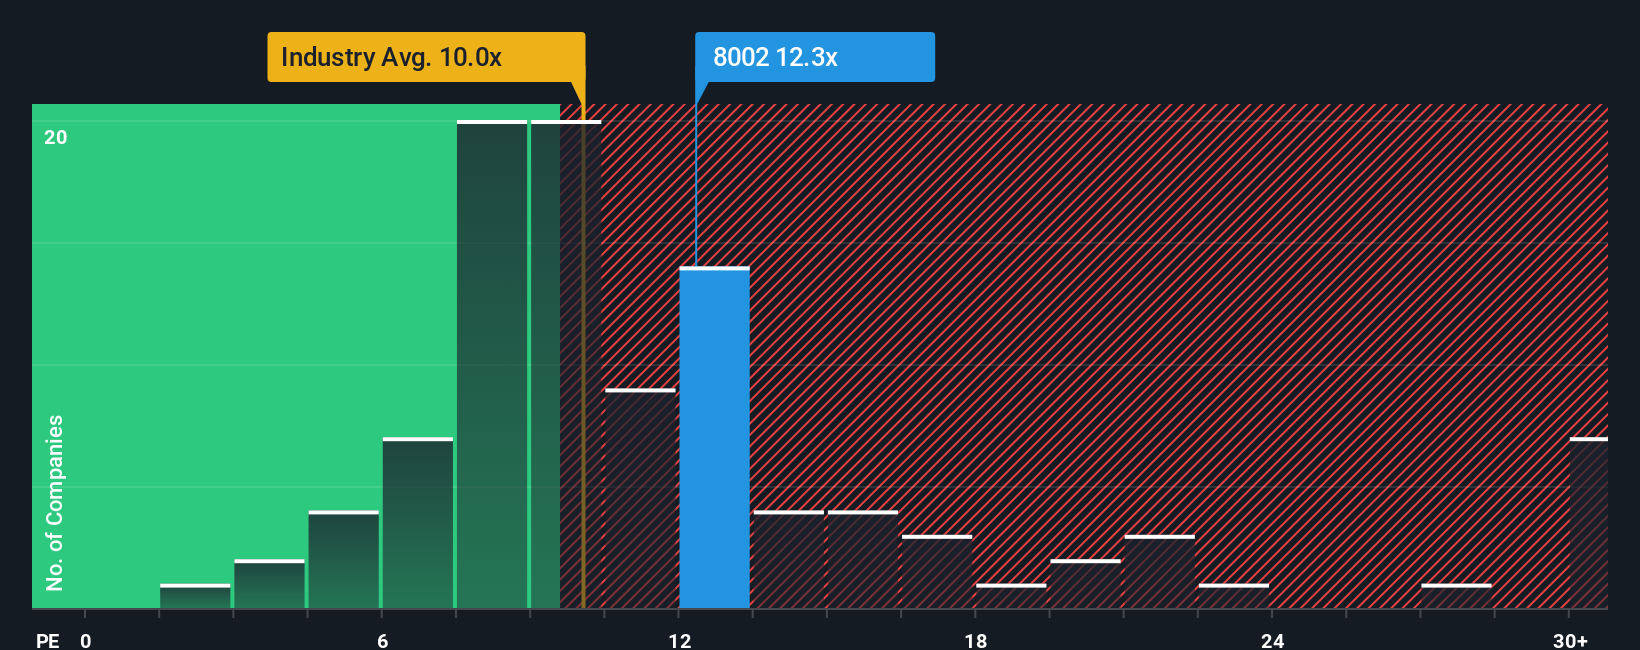
The Price-to-Earnings (PE) ratio is a widely used valuation metric for profitable businesses like Marubeni because it helps investors quickly assess how much the market is paying for each yen of current earnings. A “normal” or “fair” PE ratio is shaped by expectations for growth and the perceived risk of a company. Higher growth and lower risk typically warrant higher PE ratios.
Marubeni’s current PE ratio stands at 12.4x. For context, the broad Trade Distributors industry trades at an average of 9.8x, and Marubeni’s peers average 12.8x. At first glance, Marubeni looks slightly more expensive than its industry but generally in line with its closest peers.
However, Simply Wall St’s proprietary Fair Ratio takes this analysis further by factoring in Marubeni’s individual earnings growth outlook, profit margins, size, and specific risks in addition to industry context. For Marubeni, the Fair Ratio is calculated at 21.0x, a significant premium to both the company’s current PE and to general market benchmarks. Because it incorporates forward-looking fundamentals and risk, the Fair Ratio provides a more personalized and nuanced valuation yardstick than broad peer or sector averages.
With Marubeni trading at 12.4x, well below its Fair Ratio of 21.0x, the stock looks undervalued by this measure. This suggests that investors may not be fully appreciating its future earnings potential and risk profile.
Result: UNDERVALUED
PE ratios tell one story, but what if the real opportunity lies elsewhere? Discover companies where insiders are betting big on explosive growth.
Upgrade Your Decision Making: Choose your Marubeni Narrative
Earlier we mentioned that there is an even better way to understand valuation, so let us introduce you to Narratives. A Narrative is a simple, user-friendly way for investors to explain their view of a company by telling its story and linking that story to numbers, such as their own estimates for fair value, future revenue, earnings, and margins. Narratives turn your perspective about Marubeni into a tangible forecast and a clear fair value, helping you bridge the gap between expectations and reality.
Available on Simply Wall St’s Community page, a platform trusted by millions, Narratives make it easy to see how your story stacks up against others and current market prices. They are practical decision tools that help you know when to buy or sell by comparing your Fair Value to the market Price. Best of all, Narratives update automatically whenever fresh information or new earnings data is released, ensuring your viewpoint adapts with the facts.
For example, with Marubeni, some investors see a bright future with impressive growth and assign much higher fair values, while others remain cautious and set lower ones. Narratives let you see and compare these perspectives, so you can confidently decide what the story means for you.
Do you think there's more to the story for Marubeni? Create your own Narrative to let the Community know!
This article by Simply Wall St is general in nature. We provide commentary based on historical data and analyst forecasts only using an unbiased methodology and our articles are not intended to be financial advice. It does not constitute a recommendation to buy or sell any stock, and does not take account of your objectives, or your financial situation. We aim to bring you long-term focused analysis driven by fundamental data. Note that our analysis may not factor in the latest price-sensitive company announcements or qualitative material. Simply Wall St has no position in any stocks mentioned.
New: Manage All Your Stock Portfolios in One Place
We've created the ultimate portfolio companion for stock investors, and it's free.
• Connect an unlimited number of Portfolios and see your total in one currency
• Be alerted to new Warning Signs or Risks via email or mobile
• Track the Fair Value of your stocks
Have feedback on this article? Concerned about the content? Get in touch with us directly. Alternatively, email editorial-team@simplywallst.com
About TSE:8002
Marubeni
Marubeni Corporation purchases, distributes, and markets industrial and consumer goods.
Proven track record with adequate balance sheet and pays a dividend.
Similar Companies
Market Insights

Advertisement
Community Narratives
The Next Phase of Energy Storage: How NeoVolta Is Tackling America’s Power Crunch
Fair Value US$7.50|35.1% undervalued
MA
Community Contributor
Why EnSilica is Worth Possibly 13x its Current Price
Fair Value UK£5.00|89.8% undervalued
DO
Community Contributor
M&A Activity, Industry Diversification & A Defense Contract Monopoly Will Push BWXT For Healthy Long-Term Growth
Fair Value US$220.00|15.2% undervalued
CL
Community Contributor
A case for Cassiar Gold Corp (TSXV: GLDC) to reach CAD$8-10 before 2030 (X30-37)
Fair Value CA$10.00|96.0% undervalued
AG
Community Contributor