
Advertisement
Takara StandardLtd's (TSE:7981) Earnings Are Of Questionable Quality

Takara Standard Co.,Ltd.'s (TSE:7981) robust earnings report didn't manage to move the market for its stock. Our analysis suggests that this might be because shareholders have noticed some concerning underlying factors.
See our latest analysis for Takara StandardLtd
Examining Cashflow Against Takara StandardLtd's Earnings
As finance nerds would already know, the accrual ratio from cashflow is a key measure for assessing how well a company's free cash flow (FCF) matches its profit. In plain english, this ratio subtracts FCF from net profit, and divides that number by the company's average operating assets over that period. This ratio tells us how much of a company's profit is not backed by free cashflow.
That means a negative accrual ratio is a good thing, because it shows that the company is bringing in more free cash flow than its profit would suggest. While it's not a problem to have a positive accrual ratio, indicating a certain level of non-cash profits, a high accrual ratio is arguably a bad thing, because it indicates paper profits are not matched by cash flow. Notably, there is some academic evidence that suggests that a high accrual ratio is a bad sign for near-term profits, generally speaking.
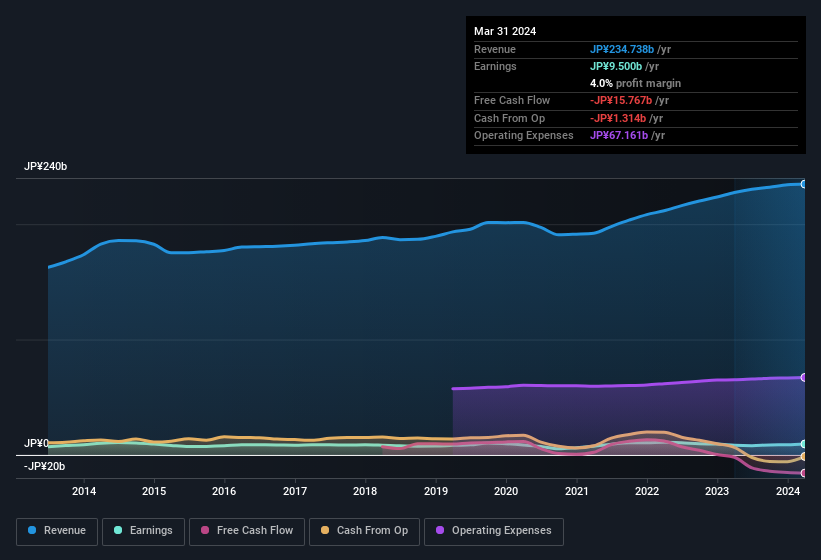
For the year to March 2024, Takara StandardLtd had an accrual ratio of 0.21. Unfortunately, that means its free cash flow fell significantly short of its reported profits. Over the last year it actually had negative free cash flow of JP¥16b, in contrast to the aforementioned profit of JP¥9.50b. We also note that Takara StandardLtd's free cash flow was actually negative last year as well, so we could understand if shareholders were bothered by its outflow of JP¥16b. However, that's not all there is to consider. We can see that unusual items have impacted its statutory profit, and therefore the accrual ratio.
Note: we always recommend investors check balance sheet strength. Click here to be taken to our balance sheet analysis of Takara StandardLtd.
The Impact Of Unusual Items On Profit
The fact that the company had unusual items boosting profit by JP¥1.1b, in the last year, probably goes some way to explain why its accrual ratio was so weak. We can't deny that higher profits generally leave us optimistic, but we'd prefer it if the profit were to be sustainable. We ran the numbers on most publicly listed companies worldwide, and it's very common for unusual items to be once-off in nature. Which is hardly surprising, given the name. Assuming those unusual items don't show up again in the current year, we'd thus expect profit to be weaker next year (in the absence of business growth, that is).
Our Take On Takara StandardLtd's Profit Performance
Takara StandardLtd had a weak accrual ratio, but its profit did receive a boost from unusual items. For the reasons mentioned above, we think that a perfunctory glance at Takara StandardLtd's statutory profits might make it look better than it really is on an underlying level. Keep in mind, when it comes to analysing a stock it's worth noting the risks involved. For instance, we've identified 2 warning signs for Takara StandardLtd (1 is a bit concerning) you should be familiar with.
In this article we've looked at a number of factors that can impair the utility of profit numbers, and we've come away cautious. But there is always more to discover if you are capable of focussing your mind on minutiae. For example, many people consider a high return on equity as an indication of favorable business economics, while others like to 'follow the money' and search out stocks that insiders are buying. While it might take a little research on your behalf, you may find this free collection of companies boasting high return on equity, or this list of stocks with significant insider holdings to be useful.
Valuation is complex, but we're here to simplify it.
Discover if Takara StandardLtd might be undervalued or overvalued with our detailed analysis, featuring fair value estimates, potential risks, dividends, insider trades, and its financial condition.
Access Free AnalysisHave feedback on this article? Concerned about the content? Get in touch with us directly. Alternatively, email editorial-team (at) simplywallst.com.
This article by Simply Wall St is general in nature. We provide commentary based on historical data and analyst forecasts only using an unbiased methodology and our articles are not intended to be financial advice. It does not constitute a recommendation to buy or sell any stock, and does not take account of your objectives, or your financial situation. We aim to bring you long-term focused analysis driven by fundamental data. Note that our analysis may not factor in the latest price-sensitive company announcements or qualitative material. Simply Wall St has no position in any stocks mentioned.
About TSE:7981
Flawless balance sheet with solid track record and pays a dividend.
Similar Companies
Market Insights

Advertisement
Community Narratives
Groundbreaking therapies that could change the treatment landscape for PTSD, fibromyalgia, MS & Alzheimer’s
Fair Value US$6.20|86.9% undervalued
CM
Community Contributor
DigitalOcean Will Grow 14% by Embracing AI with Paperspace Acquisition
Fair Value US$50.00|41.7% undervalued
NE
Community Contributor
Viant Technology: A Rising AdTech Challenger in the AI-Powered CTV Market
Fair Value US$38.61|63.2% undervalued
BL
Community Contributor
Volvo will Accelerate Forward into Electric and Autonomous Leadership in Five Years
Fair Value SEK 438.80|39.7% undervalued
UN
Community Contributor