Improved Earnings Required Before The Kinki Sharyo Co., Ltd. (TSE:7122) Stock's 32% Jump Looks Justified


Despite an already strong run, The Kinki Sharyo Co., Ltd. (TSE:7122) shares have been powering on, with a gain of 32% in the last thirty days. Looking back a bit further, it's encouraging to see the stock is up 97% in the last year.
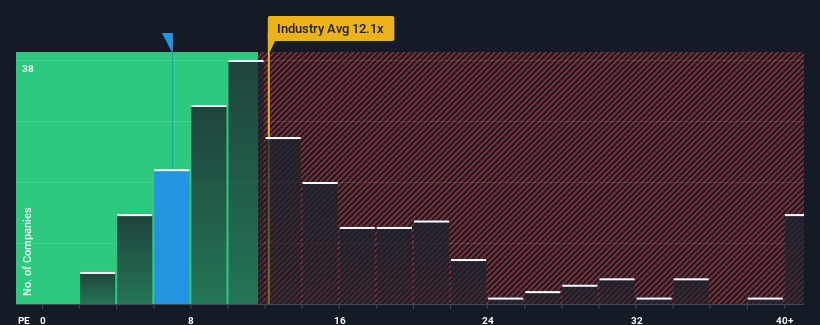
In spite of the firm bounce in price, Kinki Sharyo may still be sending very bullish signals at the moment with its price-to-earnings (or "P/E") ratio of 6.9x, since almost half of all companies in Japan have P/E ratios greater than 15x and even P/E's higher than 24x are not unusual. However, the P/E might be quite low for a reason and it requires further investigation to determine if it's justified.
For example, consider that Kinki Sharyo's financial performance has been poor lately as its earnings have been in decline. It might be that many expect the disappointing earnings performance to continue or accelerate, which has repressed the P/E. If you like the company, you'd be hoping this isn't the case so that you could potentially pick up some stock while it's out of favour.
Check out our latest analysis for Kinki Sharyo
How Is Kinki Sharyo's Growth Trending?
The only time you'd be truly comfortable seeing a P/E as depressed as Kinki Sharyo's is when the company's growth is on track to lag the market decidedly.
Taking a look back first, the company's earnings per share growth last year wasn't something to get excited about as it posted a disappointing decline of 33%. Unfortunately, that's brought it right back to where it started three years ago with EPS growth being virtually non-existent overall during that time. So it appears to us that the company has had a mixed result in terms of growing earnings over that time.
This is in contrast to the rest of the market, which is expected to grow by 11% over the next year, materially higher than the company's recent medium-term annualised growth rates.
In light of this, it's understandable that Kinki Sharyo's P/E sits below the majority of other companies. It seems most investors are expecting to see the recent limited growth rates continue into the future and are only willing to pay a reduced amount for the stock.
The Bottom Line On Kinki Sharyo's P/E
Even after such a strong price move, Kinki Sharyo's P/E still trails the rest of the market significantly. Using the price-to-earnings ratio alone to determine if you should sell your stock isn't sensible, however it can be a practical guide to the company's future prospects.
We've established that Kinki Sharyo maintains its low P/E on the weakness of its recent three-year growth being lower than the wider market forecast, as expected. At this stage investors feel the potential for an improvement in earnings isn't great enough to justify a higher P/E ratio. Unless the recent medium-term conditions improve, they will continue to form a barrier for the share price around these levels.
There are also other vital risk factors to consider before investing and we've discovered 2 warning signs for Kinki Sharyo that you should be aware of.
It's important to make sure you look for a great company, not just the first idea you come across. So take a peek at this free list of interesting companies with strong recent earnings growth (and a low P/E).
Valuation is complex, but we're here to simplify it.
Discover if Kinki Sharyo might be undervalued or overvalued with our detailed analysis, featuring fair value estimates, potential risks, dividends, insider trades, and its financial condition.
Access Free AnalysisHave feedback on this article? Concerned about the content? Get in touch with us directly. Alternatively, email editorial-team (at) simplywallst.com.
This article by Simply Wall St is general in nature. We provide commentary based on historical data and analyst forecasts only using an unbiased methodology and our articles are not intended to be financial advice. It does not constitute a recommendation to buy or sell any stock, and does not take account of your objectives, or your financial situation. We aim to bring you long-term focused analysis driven by fundamental data. Note that our analysis may not factor in the latest price-sensitive company announcements or qualitative material. Simply Wall St has no position in any stocks mentioned.
About TSE:7122
Kinki Sharyo
Manufactures and sells rolling stock in Japan, the United States, Hong Kong, the Philippines, the Middle East, and internationally.
Flawless balance sheet and good value.
Market Insights

Community Narratives

