
Advertisement
These 4 Measures Indicate That Naikai Zosen (TSE:7018) Is Using Debt Reasonably Well
Legendary fund manager Li Lu (who Charlie Munger backed) once said, 'The biggest investment risk is not the volatility of prices, but whether you will suffer a permanent loss of capital.' When we think about how risky a company is, we always like to look at its use of debt, since debt overload can lead to ruin. As with many other companies Naikai Zosen Corporation (TSE:7018) makes use of debt. But the more important question is: how much risk is that debt creating?
What Risk Does Debt Bring?
Generally speaking, debt only becomes a real problem when a company can't easily pay it off, either by raising capital or with its own cash flow. If things get really bad, the lenders can take control of the business. However, a more common (but still painful) scenario is that it has to raise new equity capital at a low price, thus permanently diluting shareholders. Of course, plenty of companies use debt to fund growth, without any negative consequences. When we examine debt levels, we first consider both cash and debt levels, together.
How Much Debt Does Naikai Zosen Carry?
You can click the graphic below for the historical numbers, but it shows that Naikai Zosen had JP¥4.19b of debt in June 2025, down from JP¥8.13b, one year before. But it also has JP¥11.6b in cash to offset that, meaning it has JP¥7.43b net cash.
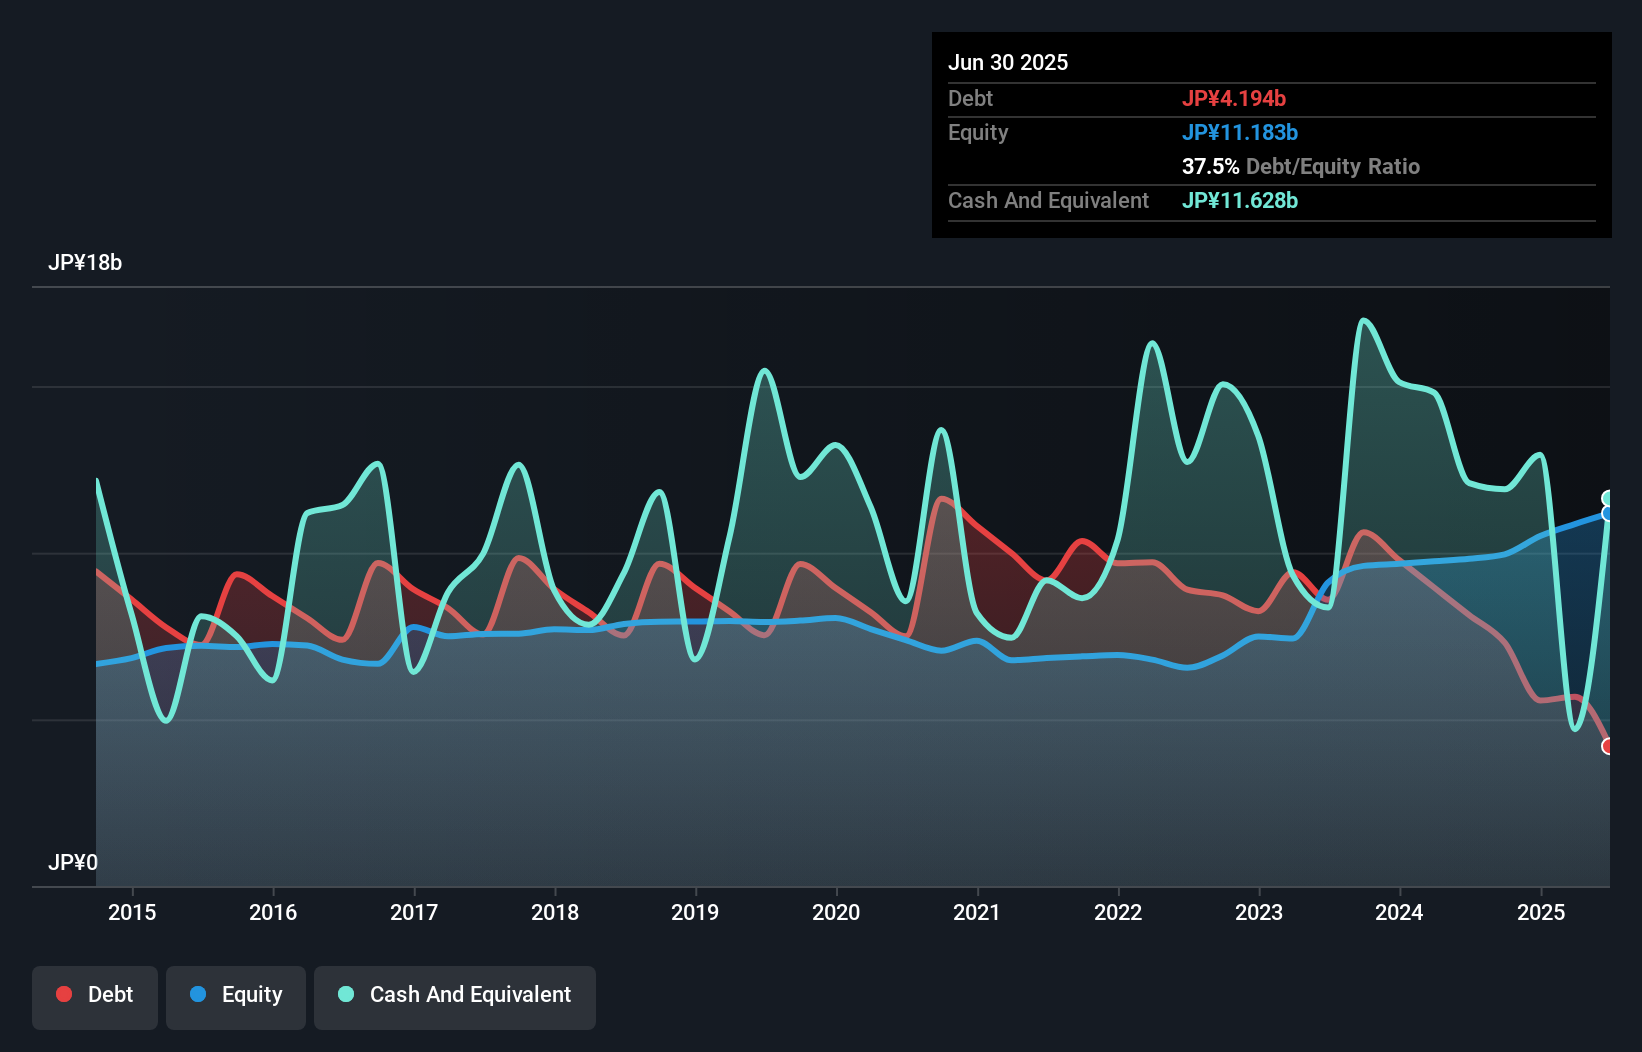
How Healthy Is Naikai Zosen's Balance Sheet?
We can see from the most recent balance sheet that Naikai Zosen had liabilities of JP¥26.4b falling due within a year, and liabilities of JP¥4.80b due beyond that. Offsetting these obligations, it had cash of JP¥11.6b as well as receivables valued at JP¥15.1b due within 12 months. So its liabilities outweigh the sum of its cash and (near-term) receivables by JP¥4.39b.
This deficit isn't so bad because Naikai Zosen is worth JP¥13.3b, and thus could probably raise enough capital to shore up its balance sheet, if the need arose. However, it is still worthwhile taking a close look at its ability to pay off debt. Despite its noteworthy liabilities, Naikai Zosen boasts net cash, so it's fair to say it does not have a heavy debt load!
View our latest analysis for Naikai Zosen
Fortunately, Naikai Zosen grew its EBIT by 8.9% in the last year, making that debt load look even more manageable. The balance sheet is clearly the area to focus on when you are analysing debt. But it is Naikai Zosen's earnings that will influence how the balance sheet holds up in the future. So when considering debt, it's definitely worth looking at the earnings trend. Click here for an interactive snapshot.
Finally, while the tax-man may adore accounting profits, lenders only accept cold hard cash. While Naikai Zosen has net cash on its balance sheet, it's still worth taking a look at its ability to convert earnings before interest and tax (EBIT) to free cash flow, to help us understand how quickly it is building (or eroding) that cash balance. During the last three years, Naikai Zosen burned a lot of cash. While investors are no doubt expecting a reversal of that situation in due course, it clearly does mean its use of debt is more risky.
Summing Up
While Naikai Zosen does have more liabilities than liquid assets, it also has net cash of JP¥7.43b. On top of that, it increased its EBIT by 8.9% in the last twelve months. So we are not troubled with Naikai Zosen's debt use. When analysing debt levels, the balance sheet is the obvious place to start. However, not all investment risk resides within the balance sheet - far from it. Be aware that Naikai Zosen is showing 2 warning signs in our investment analysis , and 1 of those is potentially serious...
Of course, if you're the type of investor who prefers buying stocks without the burden of debt, then don't hesitate to discover our exclusive list of net cash growth stocks, today.
Valuation is complex, but we're here to simplify it.
Discover if Naikai Zosen might be undervalued or overvalued with our detailed analysis, featuring fair value estimates, potential risks, dividends, insider trades, and its financial condition.
Access Free AnalysisHave feedback on this article? Concerned about the content? Get in touch with us directly. Alternatively, email editorial-team (at) simplywallst.com.
This article by Simply Wall St is general in nature. We provide commentary based on historical data and analyst forecasts only using an unbiased methodology and our articles are not intended to be financial advice. It does not constitute a recommendation to buy or sell any stock, and does not take account of your objectives, or your financial situation. We aim to bring you long-term focused analysis driven by fundamental data. Note that our analysis may not factor in the latest price-sensitive company announcements or qualitative material. Simply Wall St has no position in any stocks mentioned.
About TSE:7018
Solid track record with excellent balance sheet.
Market Insights

Advertisement
Community Narratives
Quality at a Premium. A time to watch, not to buy?
Fair Value US$154.56|27.6% undervalued
DA
Community Contributor
GRAB: The Super-App at the Heart of Southeast Asia’s Digital Boom
Fair Value US$8.20|22.1% undervalued
BL
Community Contributor
Verve Group to Surge with 51.61% Revenue Growth
Fair Value €6.00|60.0% undervalued
ME
Community Contributor