
Advertisement
Legendary fund manager Li Lu (who Charlie Munger backed) once said, 'The biggest investment risk is not the volatility of prices, but whether you will suffer a permanent loss of capital.' So it might be obvious that you need to consider debt, when you think about how risky any given stock is, because too much debt can sink a company. We can see that IHI Corporation (TSE:7013) does use debt in its business. But the more important question is: how much risk is that debt creating?
We've discovered 3 warning signs about IHI. View them for free.Why Does Debt Bring Risk?
Debt is a tool to help businesses grow, but if a business is incapable of paying off its lenders, then it exists at their mercy. In the worst case scenario, a company can go bankrupt if it cannot pay its creditors. However, a more usual (but still expensive) situation is where a company must dilute shareholders at a cheap share price simply to get debt under control. Having said that, the most common situation is where a company manages its debt reasonably well - and to its own advantage. The first thing to do when considering how much debt a business uses is to look at its cash and debt together.
What Is IHI's Net Debt?
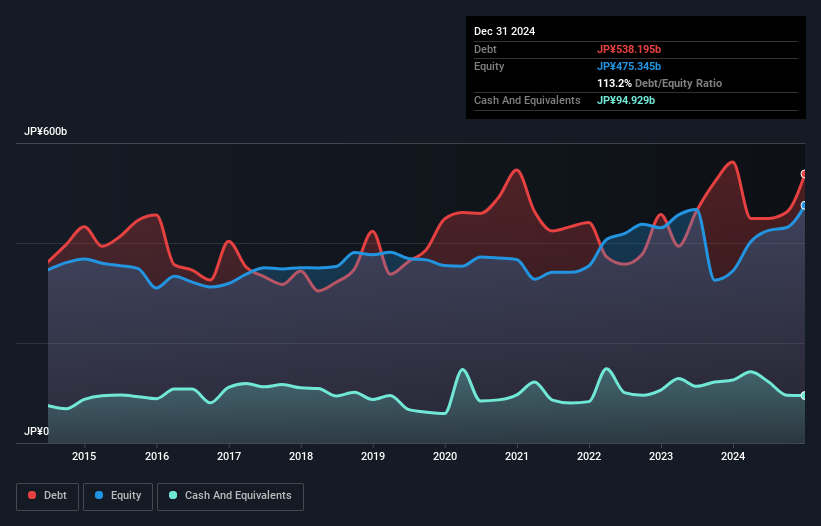
The image below, which you can click on for greater detail, shows that IHI had debt of JP¥538.2b at the end of December 2024, a reduction from JP¥561.8b over a year. However, it does have JP¥94.9b in cash offsetting this, leading to net debt of about JP¥443.3b.
How Strong Is IHI's Balance Sheet?
The latest balance sheet data shows that IHI had liabilities of JP¥1.23t due within a year, and liabilities of JP¥603.5b falling due after that. Offsetting this, it had JP¥94.9b in cash and JP¥735.4b in receivables that were due within 12 months. So its liabilities outweigh the sum of its cash and (near-term) receivables by JP¥1.01t.
This deficit is considerable relative to its very significant market capitalization of JP¥1.54t, so it does suggest shareholders should keep an eye on IHI's use of debt. Should its lenders demand that it shore up the balance sheet, shareholders would likely face severe dilution.
See our latest analysis for IHI
We measure a company's debt load relative to its earnings power by looking at its net debt divided by its earnings before interest, tax, depreciation, and amortization (EBITDA) and by calculating how easily its earnings before interest and tax (EBIT) cover its interest expense (interest cover). The advantage of this approach is that we take into account both the absolute quantum of debt (with net debt to EBITDA) and the actual interest expenses associated with that debt (with its interest cover ratio).
IHI's net debt to EBITDA ratio of about 2.5 suggests only moderate use of debt. And its commanding EBIT of 1k times its interest expense, implies the debt load is as light as a peacock feather. We also note that IHI improved its EBIT from a last year's loss to a positive JP¥136b. The balance sheet is clearly the area to focus on when you are analysing debt. But it is future earnings, more than anything, that will determine IHI's ability to maintain a healthy balance sheet going forward. So if you want to see what the professionals think, you might find this free report on analyst profit forecasts to be interesting.
But our final consideration is also important, because a company cannot pay debt with paper profits; it needs cold hard cash. So it is important to check how much of its earnings before interest and tax (EBIT) converts to actual free cash flow. In the last year, IHI's free cash flow amounted to 32% of its EBIT, less than we'd expect. That weak cash conversion makes it more difficult to handle indebtedness.
Our View
Neither IHI's ability to handle its total liabilities nor its conversion of EBIT to free cash flow gave us confidence in its ability to take on more debt. But its interest cover tells a very different story, and suggests some resilience. We think that IHI's debt does make it a bit risky, after considering the aforementioned data points together. Not all risk is bad, as it can boost share price returns if it pays off, but this debt risk is worth keeping in mind. When analysing debt levels, the balance sheet is the obvious place to start. But ultimately, every company can contain risks that exist outside of the balance sheet. For example, we've discovered 3 warning signs for IHI that you should be aware of before investing here.
When all is said and done, sometimes its easier to focus on companies that don't even need debt. Readers can access a list of growth stocks with zero net debt 100% free, right now.
New: AI Stock Screener & Alerts
Our new AI Stock Screener scans the market every day to uncover opportunities.
• Dividend Powerhouses (3%+ Yield)
• Undervalued Small Caps with Insider Buying
• High growth Tech and AI Companies
Or build your own from over 50 metrics.
Have feedback on this article? Concerned about the content? Get in touch with us directly. Alternatively, email editorial-team (at) simplywallst.com.
This article by Simply Wall St is general in nature. We provide commentary based on historical data and analyst forecasts only using an unbiased methodology and our articles are not intended to be financial advice. It does not constitute a recommendation to buy or sell any stock, and does not take account of your objectives, or your financial situation. We aim to bring you long-term focused analysis driven by fundamental data. Note that our analysis may not factor in the latest price-sensitive company announcements or qualitative material. Simply Wall St has no position in any stocks mentioned.
About TSE:7013
IHI
Designs and builds engineering solutions in Japan and internationally.
Outstanding track record with excellent balance sheet.
Similar Companies
Market Insights

Advertisement
Community Narratives
MINISO's fair value is projected at 26.69 with an anticipated PE ratio shift of 20x
Fair Value US$24.03|9.0% undervalued
BE
Community Contributor
Procter & Gamble: A Dividend Giant Facing Slowing Growth
Fair Value US$119.81|23.5% overvalued
AN
Community Contributor
Eli Lilly's Future Growth Driven by Tirzepatide and Favorable Market Conditions
Fair Value US$1.19k|14.4% undervalued
EA
Community Contributor