Stock Analysis
Investors in Fanuc (TSE:6954) have unfortunately lost 13% over the last three years


As an investor its worth striving to ensure your overall portfolio beats the market average. But if you try your hand at stock picking, you risk returning less than the market. Unfortunately, that's been the case for longer term Fanuc Corporation (TSE:6954) shareholders, since the share price is down 18% in the last three years, falling well short of the market return of around 46%.
With that in mind, it's worth seeing if the company's underlying fundamentals have been the driver of long term performance, or if there are some discrepancies.
View our latest analysis for Fanuc
While markets are a powerful pricing mechanism, share prices reflect investor sentiment, not just underlying business performance. One imperfect but simple way to consider how the market perception of a company has shifted is to compare the change in the earnings per share (EPS) with the share price movement.
Although the share price is down over three years, Fanuc actually managed to grow EPS by 13% per year in that time. This is quite a puzzle, and suggests there might be something temporarily buoying the share price. Or else the company was over-hyped in the past, and so its growth has disappointed.
Since the change in EPS doesn't seem to correlate with the change in share price, it's worth taking a look at other metrics.
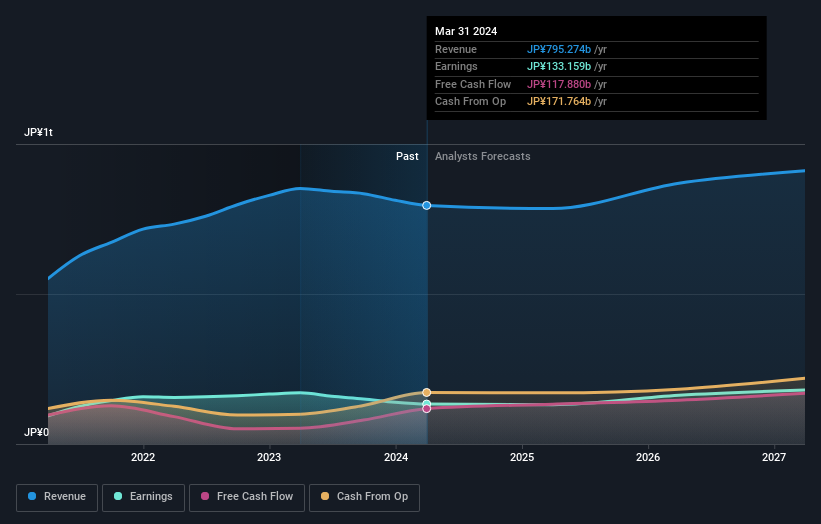
The modest 1.9% dividend yield is unlikely to be guiding the market view of the stock. Revenue is actually up 11% over the three years, so the share price drop doesn't seem to hinge on revenue, either. This analysis is just perfunctory, but it might be worth researching Fanuc more closely, as sometimes stocks fall unfairly. This could present an opportunity.
The image below shows how earnings and revenue have tracked over time (if you click on the image you can see greater detail).
Fanuc is a well known stock, with plenty of analyst coverage, suggesting some visibility into future growth. You can see what analysts are predicting for Fanuc in this interactive graph of future profit estimates.
What About Dividends?
As well as measuring the share price return, investors should also consider the total shareholder return (TSR). Whereas the share price return only reflects the change in the share price, the TSR includes the value of dividends (assuming they were reinvested) and the benefit of any discounted capital raising or spin-off. So for companies that pay a generous dividend, the TSR is often a lot higher than the share price return. We note that for Fanuc the TSR over the last 3 years was -13%, which is better than the share price return mentioned above. The dividends paid by the company have thusly boosted the total shareholder return.
A Different Perspective
While the broader market gained around 24% in the last year, Fanuc shareholders lost 12% (even including dividends). However, keep in mind that even the best stocks will sometimes underperform the market over a twelve month period. On the bright side, long term shareholders have made money, with a gain of 4% per year over half a decade. If the fundamental data continues to indicate long term sustainable growth, the current sell-off could be an opportunity worth considering. I find it very interesting to look at share price over the long term as a proxy for business performance. But to truly gain insight, we need to consider other information, too. Case in point: We've spotted 1 warning sign for Fanuc you should be aware of.
If you are like me, then you will not want to miss this free list of undervalued small caps that insiders are buying.
Please note, the market returns quoted in this article reflect the market weighted average returns of stocks that currently trade on Japanese exchanges.
Valuation is complex, but we're helping make it simple.
Find out whether Fanuc is potentially over or undervalued by checking out our comprehensive analysis, which includes fair value estimates, risks and warnings, dividends, insider transactions and financial health.
View the Free AnalysisHave feedback on this article? Concerned about the content? Get in touch with us directly. Alternatively, email editorial-team (at) simplywallst.com.
This article by Simply Wall St is general in nature. We provide commentary based on historical data and analyst forecasts only using an unbiased methodology and our articles are not intended to be financial advice. It does not constitute a recommendation to buy or sell any stock, and does not take account of your objectives, or your financial situation. We aim to bring you long-term focused analysis driven by fundamental data. Note that our analysis may not factor in the latest price-sensitive company announcements or qualitative material. Simply Wall St has no position in any stocks mentioned.
Valuation is complex, but we're helping make it simple.
Find out whether Fanuc is potentially over or undervalued by checking out our comprehensive analysis, which includes fair value estimates, risks and warnings, dividends, insider transactions and financial health.
View the Free AnalysisHave feedback on this article? Concerned about the content? Get in touch with us directly. Alternatively, email editorial-team@simplywallst.com
About TSE:6954
Fanuc
Provides factory automation products in Japan, the Americas, Europe, China, the rest of Asia, and internationally.
Flawless balance sheet average dividend payer.
