- Japan
- /
- Electrical
- /
- TSE:6927
A Piece Of The Puzzle Missing From Helios Techno Holding Co., Ltd.'s (TSE:6927) 39% Share Price Climb


Helios Techno Holding Co., Ltd. (TSE:6927) shareholders would be excited to see that the share price has had a great month, posting a 39% gain and recovering from prior weakness. Unfortunately, despite the strong performance over the last month, the full year gain of 2.2% isn't as attractive.
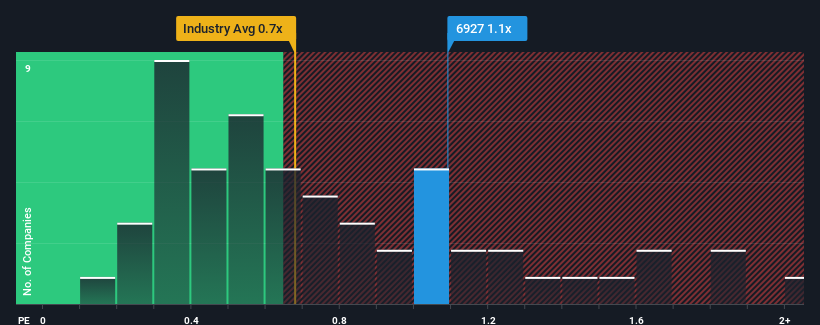
Even after such a large jump in price, there still wouldn't be many who think Helios Techno Holding's price-to-sales (or "P/S") ratio of 1.1x is worth a mention when the median P/S in Japan's Electrical industry is similar at about 0.7x. While this might not raise any eyebrows, if the P/S ratio is not justified investors could be missing out on a potential opportunity or ignoring looming disappointment.
View our latest analysis for Helios Techno Holding
What Does Helios Techno Holding's Recent Performance Look Like?
Recent times have been quite advantageous for Helios Techno Holding as its revenue has been rising very briskly. Perhaps the market is expecting future revenue performance to taper off, which has kept the P/S from rising. Those who are bullish on Helios Techno Holding will be hoping that this isn't the case, so that they can pick up the stock at a lower valuation.
Want the full picture on earnings, revenue and cash flow for the company? Then our free report on Helios Techno Holding will help you shine a light on its historical performance.What Are Revenue Growth Metrics Telling Us About The P/S?
The only time you'd be comfortable seeing a P/S like Helios Techno Holding's is when the company's growth is tracking the industry closely.
Taking a look back first, we see that the company grew revenue by an impressive 36% last year. The latest three year period has also seen an excellent 35% overall rise in revenue, aided by its short-term performance. So we can start by confirming that the company has done a great job of growing revenue over that time.
This is in contrast to the rest of the industry, which is expected to grow by 3.8% over the next year, materially lower than the company's recent medium-term annualised growth rates.
With this information, we find it interesting that Helios Techno Holding is trading at a fairly similar P/S compared to the industry. Apparently some shareholders believe the recent performance is at its limits and have been accepting lower selling prices.
What Does Helios Techno Holding's P/S Mean For Investors?
Helios Techno Holding appears to be back in favour with a solid price jump bringing its P/S back in line with other companies in the industry We'd say the price-to-sales ratio's power isn't primarily as a valuation instrument but rather to gauge current investor sentiment and future expectations.
We've established that Helios Techno Holding currently trades on a lower than expected P/S since its recent three-year growth is higher than the wider industry forecast. When we see strong revenue with faster-than-industry growth, we can only assume potential risks are what might be placing pressure on the P/S ratio. While recent revenue trends over the past medium-term suggest that the risk of a price decline is low, investors appear to see the likelihood of revenue fluctuations in the future.
Don't forget that there may be other risks. For instance, we've identified 4 warning signs for Helios Techno Holding (1 is potentially serious) you should be aware of.
Of course, profitable companies with a history of great earnings growth are generally safer bets. So you may wish to see this free collection of other companies that have reasonable P/E ratios and have grown earnings strongly.
If you're looking to trade Helios Techno Holding, open an account with the lowest-cost platform trusted by professionals, Interactive Brokers.
With clients in over 200 countries and territories, and access to 160 markets, IBKR lets you trade stocks, options, futures, forex, bonds and funds from a single integrated account.
Enjoy no hidden fees, no account minimums, and FX conversion rates as low as 0.03%, far better than what most brokers offer.
Sponsored ContentValuation is complex, but we're here to simplify it.
Discover if Helios Techno Holding might be undervalued or overvalued with our detailed analysis, featuring fair value estimates, potential risks, dividends, insider trades, and its financial condition.
Access Free AnalysisHave feedback on this article? Concerned about the content? Get in touch with us directly. Alternatively, email editorial-team (at) simplywallst.com.
This article by Simply Wall St is general in nature. We provide commentary based on historical data and analyst forecasts only using an unbiased methodology and our articles are not intended to be financial advice. It does not constitute a recommendation to buy or sell any stock, and does not take account of your objectives, or your financial situation. We aim to bring you long-term focused analysis driven by fundamental data. Note that our analysis may not factor in the latest price-sensitive company announcements or qualitative material. Simply Wall St has no position in any stocks mentioned.
About TSE:6927
Helios Techno Holding
Engages in the lamp and manufacturing equipment businesses in Japan.
Flawless balance sheet average dividend payer.
Market Insights

Community Narratives

