

Key Insights
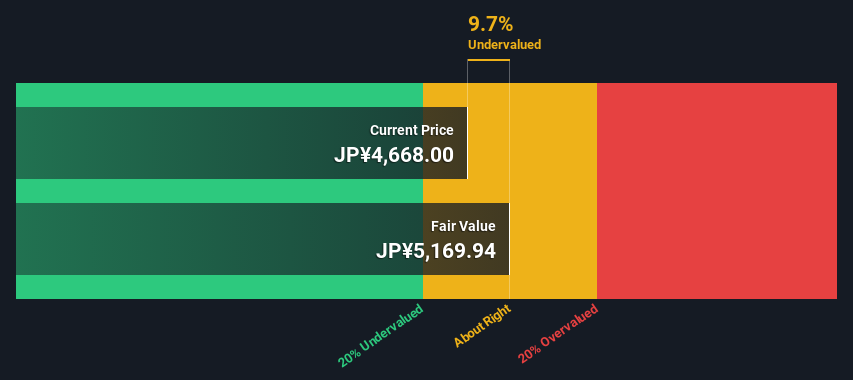
- Using the 2 Stage Free Cash Flow to Equity, Makita fair value estimate is JP¥5,170
- Makita's JP¥4,668 share price indicates it is trading at similar levels as its fair value estimate
- Our fair value estimate is similar to Makita's analyst price target of JP¥5,194
How far off is Makita Corporation (TSE:6586) from its intrinsic value? Using the most recent financial data, we'll take a look at whether the stock is fairly priced by projecting its future cash flows and then discounting them to today's value. Our analysis will employ the Discounted Cash Flow (DCF) model. Believe it or not, it's not too difficult to follow, as you'll see from our example!
Companies can be valued in a lot of ways, so we would point out that a DCF is not perfect for every situation. If you still have some burning questions about this type of valuation, take a look at the Simply Wall St analysis model.
See our latest analysis for Makita
Crunching The Numbers
We use what is known as a 2-stage model, which simply means we have two different periods of growth rates for the company's cash flows. Generally the first stage is higher growth, and the second stage is a lower growth phase. To begin with, we have to get estimates of the next ten years of cash flows. Where possible we use analyst estimates, but when these aren't available we extrapolate the previous free cash flow (FCF) from the last estimate or reported value. We assume companies with shrinking free cash flow will slow their rate of shrinkage, and that companies with growing free cash flow will see their growth rate slow, over this period. We do this to reflect that growth tends to slow more in the early years than it does in later years.
A DCF is all about the idea that a dollar in the future is less valuable than a dollar today, so we need to discount the sum of these future cash flows to arrive at a present value estimate:
10-year free cash flow (FCF) estimate
| 2025 | 2026 | 2027 | 2028 | 2029 | 2030 | 2031 | 2032 | 2033 | 2034 | |
| Levered FCF (¥, Millions) | JP¥49.0b | JP¥48.3b | JP¥49.4b | JP¥58.3b | JP¥63.9b | JP¥67.8b | JP¥70.8b | JP¥73.0b | JP¥74.6b | JP¥75.8b |
| Growth Rate Estimate Source | Analyst x6 | Analyst x7 | Analyst x6 | Analyst x2 | Analyst x2 | Est @ 6.07% | Est @ 4.33% | Est @ 3.11% | Est @ 2.25% | Est @ 1.66% |
| Present Value (¥, Millions) Discounted @ 5.2% | JP¥46.6k | JP¥43.7k | JP¥42.4k | JP¥47.5k | JP¥49.6k | JP¥50.0k | JP¥49.5k | JP¥48.5k | JP¥47.2k | JP¥45.6k |
("Est" = FCF growth rate estimated by Simply Wall St)
Present Value of 10-year Cash Flow (PVCF) = JP¥470b
We now need to calculate the Terminal Value, which accounts for all the future cash flows after this ten year period. For a number of reasons a very conservative growth rate is used that cannot exceed that of a country's GDP growth. In this case we have used the 5-year average of the 10-year government bond yield (0.3%) to estimate future growth. In the same way as with the 10-year 'growth' period, we discount future cash flows to today's value, using a cost of equity of 5.2%.
Terminal Value (TV)= FCF2034 × (1 + g) ÷ (r – g) = JP¥76b× (1 + 0.3%) ÷ (5.2%– 0.3%) = JP¥1.5t
Present Value of Terminal Value (PVTV)= TV / (1 + r)10= JP¥1.5t÷ ( 1 + 5.2%)10= JP¥920b
The total value is the sum of cash flows for the next ten years plus the discounted terminal value, which results in the Total Equity Value, which in this case is JP¥1.4t. To get the intrinsic value per share, we divide this by the total number of shares outstanding. Compared to the current share price of JP¥4.7k, the company appears about fair value at a 9.7% discount to where the stock price trades currently. Remember though, that this is just an approximate valuation, and like any complex formula - garbage in, garbage out.
The Assumptions
The calculation above is very dependent on two assumptions. The first is the discount rate and the other is the cash flows. You don't have to agree with these inputs, I recommend redoing the calculations yourself and playing with them. The DCF also does not consider the possible cyclicality of an industry, or a company's future capital requirements, so it does not give a full picture of a company's potential performance. Given that we are looking at Makita as potential shareholders, the cost of equity is used as the discount rate, rather than the cost of capital (or weighted average cost of capital, WACC) which accounts for debt. In this calculation we've used 5.2%, which is based on a levered beta of 0.997. Beta is a measure of a stock's volatility, compared to the market as a whole. We get our beta from the industry average beta of globally comparable companies, with an imposed limit between 0.8 and 2.0, which is a reasonable range for a stable business.
SWOT Analysis for Makita
- Earnings growth over the past year exceeded the industry.
- Debt is not viewed as a risk.
- Dividends are covered by earnings and cash flows.
- Dividend is low compared to the top 25% of dividend payers in the Machinery market.
- Annual earnings are forecast to grow faster than the Japanese market.
- Current share price is below our estimate of fair value.
- Annual revenue is forecast to grow slower than the Japanese market.
Looking Ahead:
Whilst important, the DCF calculation ideally won't be the sole piece of analysis you scrutinize for a company. The DCF model is not a perfect stock valuation tool. Instead the best use for a DCF model is to test certain assumptions and theories to see if they would lead to the company being undervalued or overvalued. For example, changes in the company's cost of equity or the risk free rate can significantly impact the valuation. For Makita, there are three important aspects you should assess:
- Financial Health: Does 6586 have a healthy balance sheet? Take a look at our free balance sheet analysis with six simple checks on key factors like leverage and risk.
- Future Earnings: How does 6586's growth rate compare to its peers and the wider market? Dig deeper into the analyst consensus number for the upcoming years by interacting with our free analyst growth expectation chart.
- Other Solid Businesses: Low debt, high returns on equity and good past performance are fundamental to a strong business. Why not explore our interactive list of stocks with solid business fundamentals to see if there are other companies you may not have considered!
PS. The Simply Wall St app conducts a discounted cash flow valuation for every stock on the TSE every day. If you want to find the calculation for other stocks just search here.
New: Manage All Your Stock Portfolios in One Place
We've created the ultimate portfolio companion for stock investors, and it's free.
• Connect an unlimited number of Portfolios and see your total in one currency
• Be alerted to new Warning Signs or Risks via email or mobile
• Track the Fair Value of your stocks
Have feedback on this article? Concerned about the content? Get in touch with us directly. Alternatively, email editorial-team (at) simplywallst.com.
This article by Simply Wall St is general in nature. We provide commentary based on historical data and analyst forecasts only using an unbiased methodology and our articles are not intended to be financial advice. It does not constitute a recommendation to buy or sell any stock, and does not take account of your objectives, or your financial situation. We aim to bring you long-term focused analysis driven by fundamental data. Note that our analysis may not factor in the latest price-sensitive company announcements or qualitative material. Simply Wall St has no position in any stocks mentioned.
About TSE:6586
Makita
Engages in the manufacture and sale of electric power tools, pneumatic tools, and gardening and household equipment in Japan, Europe, North America, Asia, Australia, Brazil, and the United Arab Emirates.
Flawless balance sheet with proven track record and pays a dividend.
Similar Companies
Market Insights

Community Narratives

