
Advertisement
- Japan
- /
- Construction
- /
- TSE:6540
Further Upside For Semba Corporation (TSE:6540) Shares Could Introduce Price Risks After 46% Bounce

The Semba Corporation (TSE:6540) share price has done very well over the last month, posting an excellent gain of 46%. Looking back a bit further, it's encouraging to see the stock is up 68% in the last year.
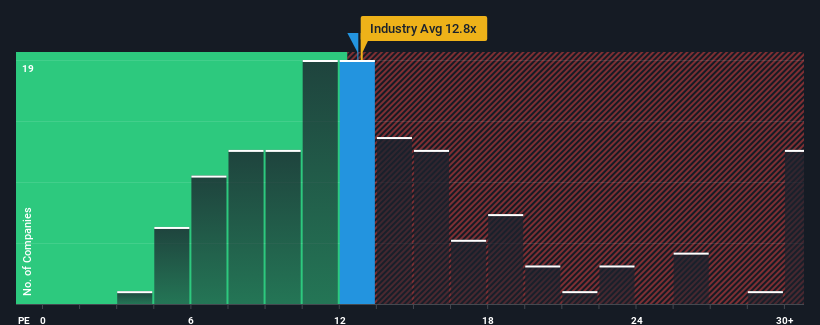
In spite of the firm bounce in price, you could still be forgiven for feeling indifferent about Semba's P/E ratio of 12.7x, since the median price-to-earnings (or "P/E") ratio in Japan is also close to 14x. While this might not raise any eyebrows, if the P/E ratio is not justified investors could be missing out on a potential opportunity or ignoring looming disappointment.
Semba certainly has been doing a great job lately as it's been growing earnings at a really rapid pace. The P/E is probably moderate because investors think this strong earnings growth might not be enough to outperform the broader market in the near future. If you like the company, you'd be hoping this isn't the case so that you could potentially pick up some stock while it's not quite in favour.
See our latest analysis for Semba
What Are Growth Metrics Telling Us About The P/E?
There's an inherent assumption that a company should be matching the market for P/E ratios like Semba's to be considered reasonable.
Taking a look back first, we see that the company grew earnings per share by an impressive 127% last year. The latest three year period has also seen an excellent 182% overall rise in EPS, aided by its short-term performance. Accordingly, shareholders would have probably welcomed those medium-term rates of earnings growth.
Comparing that to the market, which is only predicted to deliver 11% growth in the next 12 months, the company's momentum is stronger based on recent medium-term annualised earnings results.
With this information, we find it interesting that Semba is trading at a fairly similar P/E to the market. Apparently some shareholders believe the recent performance is at its limits and have been accepting lower selling prices.
What We Can Learn From Semba's P/E?
Its shares have lifted substantially and now Semba's P/E is also back up to the market median. While the price-to-earnings ratio shouldn't be the defining factor in whether you buy a stock or not, it's quite a capable barometer of earnings expectations.
Our examination of Semba revealed its three-year earnings trends aren't contributing to its P/E as much as we would have predicted, given they look better than current market expectations. There could be some unobserved threats to earnings preventing the P/E ratio from matching this positive performance. It appears some are indeed anticipating earnings instability, because the persistence of these recent medium-term conditions would normally provide a boost to the share price.
And what about other risks? Every company has them, and we've spotted 5 warning signs for Semba (of which 3 are a bit unpleasant!) you should know about.
If you're unsure about the strength of Semba's business, why not explore our interactive list of stocks with solid business fundamentals for some other companies you may have missed.
New: Manage All Your Stock Portfolios in One Place
We've created the ultimate portfolio companion for stock investors, and it's free.
• Connect an unlimited number of Portfolios and see your total in one currency
• Be alerted to new Warning Signs or Risks via email or mobile
• Track the Fair Value of your stocks
Have feedback on this article? Concerned about the content? Get in touch with us directly. Alternatively, email editorial-team (at) simplywallst.com.
This article by Simply Wall St is general in nature. We provide commentary based on historical data and analyst forecasts only using an unbiased methodology and our articles are not intended to be financial advice. It does not constitute a recommendation to buy or sell any stock, and does not take account of your objectives, or your financial situation. We aim to bring you long-term focused analysis driven by fundamental data. Note that our analysis may not factor in the latest price-sensitive company announcements or qualitative material. Simply Wall St has no position in any stocks mentioned.
About TSE:6540
Semba
Plans, designs, constructs, and supervises commercial spaces in Japan, Taiwan, and internationally.
Flawless balance sheet with solid track record and pays a dividend.
Market Insights

Advertisement
Community Narratives
Groundbreaking therapies that could change the treatment landscape for PTSD, fibromyalgia, MS & Alzheimer’s
Fair Value US$6.20|86.9% undervalued
CM
Community Contributor
DigitalOcean Will Grow 14% by Embracing AI with Paperspace Acquisition
Fair Value US$50.00|41.7% undervalued
NE
Community Contributor
Viant Technology: A Rising AdTech Challenger in the AI-Powered CTV Market
Fair Value US$38.61|63.2% undervalued
BL
Community Contributor
Volvo will Accelerate Forward into Electric and Autonomous Leadership in Five Years
Fair Value SEK 438.80|39.7% undervalued
UN
Community Contributor