

The external fund manager backed by Berkshire Hathaway's Charlie Munger, Li Lu, makes no bones about it when he says 'The biggest investment risk is not the volatility of prices, but whether you will suffer a permanent loss of capital.' When we think about how risky a company is, we always like to look at its use of debt, since debt overload can lead to ruin. We note that Sanyo Denki Co., Ltd. (TSE:6516) does have debt on its balance sheet. But should shareholders be worried about its use of debt?
When Is Debt Dangerous?
Generally speaking, debt only becomes a real problem when a company can't easily pay it off, either by raising capital or with its own cash flow. If things get really bad, the lenders can take control of the business. However, a more usual (but still expensive) situation is where a company must dilute shareholders at a cheap share price simply to get debt under control. Of course, plenty of companies use debt to fund growth, without any negative consequences. When we think about a company's use of debt, we first look at cash and debt together.
Check out our latest analysis for Sanyo Denki
What Is Sanyo Denki's Net Debt?
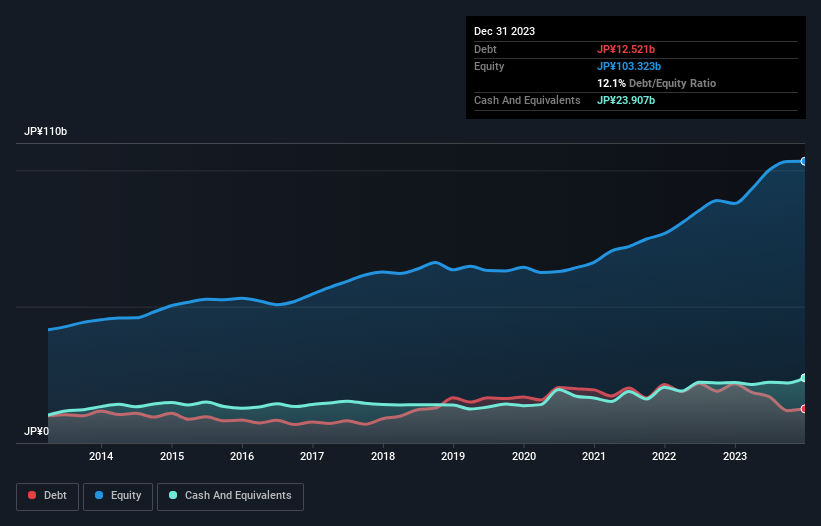
The image below, which you can click on for greater detail, shows that Sanyo Denki had debt of JP¥12.5b at the end of December 2023, a reduction from JP¥21.7b over a year. However, its balance sheet shows it holds JP¥23.9b in cash, so it actually has JP¥11.4b net cash.
A Look At Sanyo Denki's Liabilities
According to the last reported balance sheet, Sanyo Denki had liabilities of JP¥31.9b due within 12 months, and liabilities of JP¥10.5b due beyond 12 months. Offsetting this, it had JP¥23.9b in cash and JP¥32.9b in receivables that were due within 12 months. So it can boast JP¥14.5b more liquid assets than total liabilities.
This excess liquidity suggests that Sanyo Denki is taking a careful approach to debt. Because it has plenty of assets, it is unlikely to have trouble with its lenders. Succinctly put, Sanyo Denki boasts net cash, so it's fair to say it does not have a heavy debt load!
The good news is that Sanyo Denki has increased its EBIT by 2.5% over twelve months, which should ease any concerns about debt repayment. There's no doubt that we learn most about debt from the balance sheet. But it is future earnings, more than anything, that will determine Sanyo Denki's ability to maintain a healthy balance sheet going forward. So if you want to see what the professionals think, you might find this free report on analyst profit forecasts to be interesting.
Finally, while the tax-man may adore accounting profits, lenders only accept cold hard cash. While Sanyo Denki has net cash on its balance sheet, it's still worth taking a look at its ability to convert earnings before interest and tax (EBIT) to free cash flow, to help us understand how quickly it is building (or eroding) that cash balance. During the last three years, Sanyo Denki produced sturdy free cash flow equating to 51% of its EBIT, about what we'd expect. This free cash flow puts the company in a good position to pay down debt, when appropriate.
Summing Up
While it is always sensible to investigate a company's debt, in this case Sanyo Denki has JP¥11.4b in net cash and a decent-looking balance sheet. So we don't think Sanyo Denki's use of debt is risky. There's no doubt that we learn most about debt from the balance sheet. However, not all investment risk resides within the balance sheet - far from it. Case in point: We've spotted 2 warning signs for Sanyo Denki you should be aware of, and 1 of them is concerning.
When all is said and done, sometimes its easier to focus on companies that don't even need debt. Readers can access a list of growth stocks with zero net debt 100% free, right now.
If you're looking to trade Sanyo Denki, open an account with the lowest-cost platform trusted by professionals, Interactive Brokers.
With clients in over 200 countries and territories, and access to 160 markets, IBKR lets you trade stocks, options, futures, forex, bonds and funds from a single integrated account.
Enjoy no hidden fees, no account minimums, and FX conversion rates as low as 0.03%, far better than what most brokers offer.
Sponsored ContentNew: Manage All Your Stock Portfolios in One Place
We've created the ultimate portfolio companion for stock investors, and it's free.
• Connect an unlimited number of Portfolios and see your total in one currency
• Be alerted to new Warning Signs or Risks via email or mobile
• Track the Fair Value of your stocks
Have feedback on this article? Concerned about the content? Get in touch with us directly. Alternatively, email editorial-team (at) simplywallst.com.
This article by Simply Wall St is general in nature. We provide commentary based on historical data and analyst forecasts only using an unbiased methodology and our articles are not intended to be financial advice. It does not constitute a recommendation to buy or sell any stock, and does not take account of your objectives, or your financial situation. We aim to bring you long-term focused analysis driven by fundamental data. Note that our analysis may not factor in the latest price-sensitive company announcements or qualitative material. Simply Wall St has no position in any stocks mentioned.
About TSE:6516
Sanyo Denki
Engages in cooling systems, power systems, servo systems, electrical equipment sales, and electrical works contracting businesses in Japan and internationally.
Flawless balance sheet average dividend payer.
Similar Companies
Market Insights

Community Narratives

