
Advertisement
- Japan
- /
- Electrical
- /
- TSE:6507
Are Strong Financial Prospects The Force That Is Driving The Momentum In Sinfonia Technology Co.,Ltd.'s TSE:6507) Stock?
Most readers would already be aware that Sinfonia TechnologyLtd's (TSE:6507) stock increased significantly by 30% over the past month. Given the company's impressive performance, we decided to study its financial indicators more closely as a company's financial health over the long-term usually dictates market outcomes. In this article, we decided to focus on Sinfonia TechnologyLtd's ROE.
Return on equity or ROE is an important factor to be considered by a shareholder because it tells them how effectively their capital is being reinvested. Put another way, it reveals the company's success at turning shareholder investments into profits.
How To Calculate Return On Equity?
ROE can be calculated by using the formula:
Return on Equity = Net Profit (from continuing operations) ÷ Shareholders' Equity
So, based on the above formula, the ROE for Sinfonia TechnologyLtd is:
15% = JP¥12b ÷ JP¥79b (Based on the trailing twelve months to June 2025).
The 'return' is the yearly profit. That means that for every ¥1 worth of shareholders' equity, the company generated ¥0.15 in profit.
See our latest analysis for Sinfonia TechnologyLtd
What Has ROE Got To Do With Earnings Growth?
We have already established that ROE serves as an efficient profit-generating gauge for a company's future earnings. Depending on how much of these profits the company reinvests or "retains", and how effectively it does so, we are then able to assess a company’s earnings growth potential. Assuming everything else remains unchanged, the higher the ROE and profit retention, the higher the growth rate of a company compared to companies that don't necessarily bear these characteristics.
Sinfonia TechnologyLtd's Earnings Growth And 15% ROE
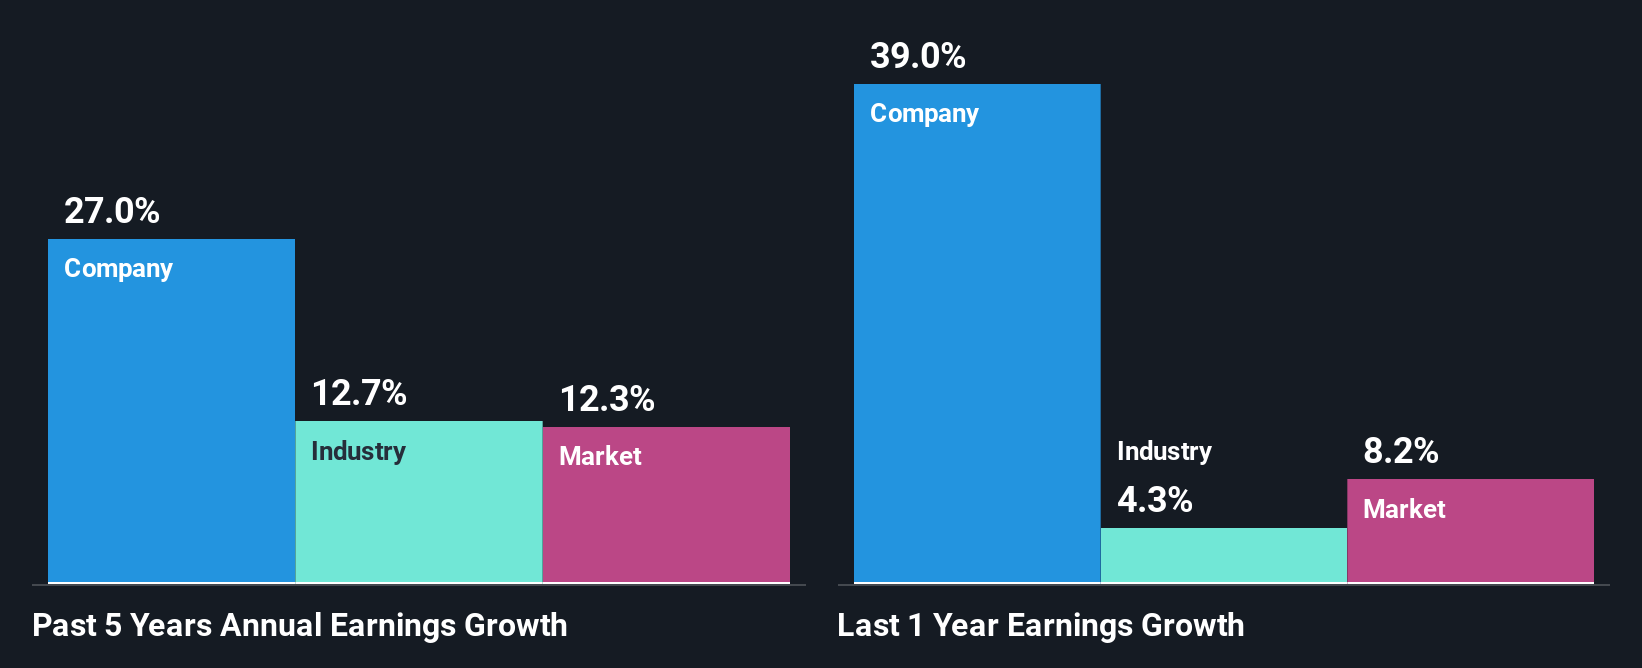
To begin with, Sinfonia TechnologyLtd seems to have a respectable ROE. Especially when compared to the industry average of 8.1% the company's ROE looks pretty impressive. This certainly adds some context to Sinfonia TechnologyLtd's exceptional 27% net income growth seen over the past five years. We reckon that there could also be other factors at play here. For instance, the company has a low payout ratio or is being managed efficiently.
We then compared Sinfonia TechnologyLtd's net income growth with the industry and we're pleased to see that the company's growth figure is higher when compared with the industry which has a growth rate of 13% in the same 5-year period.
Earnings growth is an important metric to consider when valuing a stock. It’s important for an investor to know whether the market has priced in the company's expected earnings growth (or decline). Doing so will help them establish if the stock's future looks promising or ominous. If you're wondering about Sinfonia TechnologyLtd's's valuation, check out this gauge of its price-to-earnings ratio, as compared to its industry.
Is Sinfonia TechnologyLtd Efficiently Re-investing Its Profits?
Sinfonia TechnologyLtd has a three-year median payout ratio of 26% (where it is retaining 74% of its income) which is not too low or not too high. By the looks of it, the dividend is well covered and Sinfonia TechnologyLtd is reinvesting its profits efficiently as evidenced by its exceptional growth which we discussed above.
Moreover, Sinfonia TechnologyLtd is determined to keep sharing its profits with shareholders which we infer from its long history of paying a dividend for at least ten years.
Conclusion
Overall, we are quite pleased with Sinfonia TechnologyLtd's performance. Specifically, we like that the company is reinvesting a huge chunk of its profits at a high rate of return. This of course has caused the company to see substantial growth in its earnings. Having said that, the company's earnings growth is expected to slow down, as forecasted in the current analyst estimates. To know more about the company's future earnings growth forecasts take a look at this free report on analyst forecasts for the company to find out more.
New: Manage All Your Stock Portfolios in One Place
We've created the ultimate portfolio companion for stock investors, and it's free.
• Connect an unlimited number of Portfolios and see your total in one currency
• Be alerted to new Warning Signs or Risks via email or mobile
• Track the Fair Value of your stocks
Have feedback on this article? Concerned about the content? Get in touch with us directly. Alternatively, email editorial-team (at) simplywallst.com.
This article by Simply Wall St is general in nature. We provide commentary based on historical data and analyst forecasts only using an unbiased methodology and our articles are not intended to be financial advice. It does not constitute a recommendation to buy or sell any stock, and does not take account of your objectives, or your financial situation. We aim to bring you long-term focused analysis driven by fundamental data. Note that our analysis may not factor in the latest price-sensitive company announcements or qualitative material. Simply Wall St has no position in any stocks mentioned.
About TSE:6507
Sinfonia TechnologyLtd
Manufactures and sells semiconductor, aerospace, automobile, mobility, and industrial electrical equipment.
Flawless balance sheet with solid track record.
Similar Companies
Market Insights

Advertisement
Community Narratives
Kodiak AI - a potential 100 bagger opportunity?
Fair Value US$14.00|44.7% undervalued
DA
Community Contributor
A Fair Price for a Great Business Facing Real Threats
Fair Value US$383.06|10.4% undervalued
IM
Community Contributor
AXON And Shopify Integration Will Unlock Global Mobile Advertising
Fair Value US$646.30|12.4% undervalued
AN
Based on Analyst Price Targets