
Advertisement
Key Insights
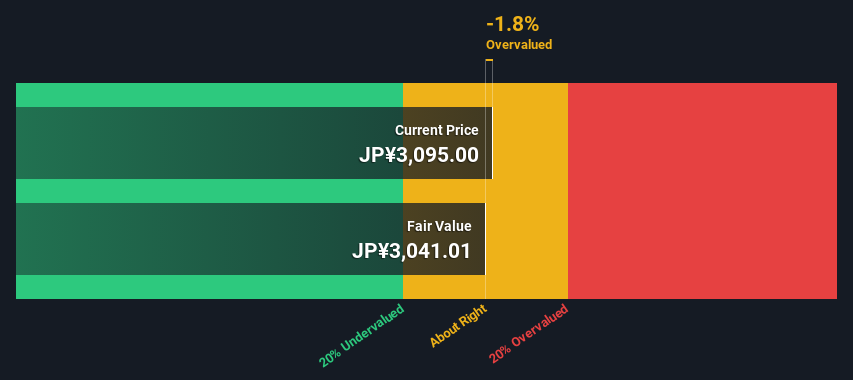
- Using the 2 Stage Free Cash Flow to Equity, Sinfonia TechnologyLtd fair value estimate is JP¥3,041
- Current share price of JP¥3,095 suggests Sinfonia TechnologyLtd is potentially trading close to its fair value
- Industry average of 33% suggests Sinfonia TechnologyLtd's peers are currently trading at a higher premium to fair value
In this article we are going to estimate the intrinsic value of Sinfonia Technology Co.,Ltd. (TSE:6507) by taking the expected future cash flows and discounting them to today's value. This will be done using the Discounted Cash Flow (DCF) model. There's really not all that much to it, even though it might appear quite complex.
Remember though, that there are many ways to estimate a company's value, and a DCF is just one method. If you want to learn more about discounted cash flow, the rationale behind this calculation can be read in detail in the Simply Wall St analysis model.
See our latest analysis for Sinfonia TechnologyLtd
Crunching The Numbers
We're using the 2-stage growth model, which simply means we take in account two stages of company's growth. In the initial period the company may have a higher growth rate and the second stage is usually assumed to have a stable growth rate. To begin with, we have to get estimates of the next ten years of cash flows. Seeing as no analyst estimates of free cash flow are available to us, we have extrapolate the previous free cash flow (FCF) from the company's last reported value. We assume companies with shrinking free cash flow will slow their rate of shrinkage, and that companies with growing free cash flow will see their growth rate slow, over this period. We do this to reflect that growth tends to slow more in the early years than it does in later years.
Generally we assume that a dollar today is more valuable than a dollar in the future, so we need to discount the sum of these future cash flows to arrive at a present value estimate:
10-year free cash flow (FCF) estimate
| 2024 | 2025 | 2026 | 2027 | 2028 | 2029 | 2030 | 2031 | 2032 | 2033 | |
| Levered FCF (¥, Millions) | JP¥5.78b | JP¥5.91b | JP¥6.00b | JP¥6.07b | JP¥6.12b | JP¥6.16b | JP¥6.20b | JP¥6.22b | JP¥6.24b | JP¥6.26b |
| Growth Rate Estimate Source | Est @ 3.09% | Est @ 2.21% | Est @ 1.60% | Est @ 1.17% | Est @ 0.86% | Est @ 0.65% | Est @ 0.51% | Est @ 0.40% | Est @ 0.33% | Est @ 0.28% |
| Present Value (¥, Millions) Discounted @ 7.3% | JP¥5.4k | JP¥5.1k | JP¥4.9k | JP¥4.6k | JP¥4.3k | JP¥4.0k | JP¥3.8k | JP¥3.5k | JP¥3.3k | JP¥3.1k |
("Est" = FCF growth rate estimated by Simply Wall St)
Present Value of 10-year Cash Flow (PVCF) = JP¥42b
After calculating the present value of future cash flows in the initial 10-year period, we need to calculate the Terminal Value, which accounts for all future cash flows beyond the first stage. The Gordon Growth formula is used to calculate Terminal Value at a future annual growth rate equal to the 5-year average of the 10-year government bond yield of 0.2%. We discount the terminal cash flows to today's value at a cost of equity of 7.3%.
Terminal Value (TV)= FCF2033 × (1 + g) ÷ (r – g) = JP¥6.3b× (1 + 0.2%) ÷ (7.3%– 0.2%) = JP¥88b
Present Value of Terminal Value (PVTV)= TV / (1 + r)10= JP¥88b÷ ( 1 + 7.3%)10= JP¥44b
The total value is the sum of cash flows for the next ten years plus the discounted terminal value, which results in the Total Equity Value, which in this case is JP¥86b. In the final step we divide the equity value by the number of shares outstanding. Compared to the current share price of JP¥3.1k, the company appears around fair value at the time of writing. Valuations are imprecise instruments though, rather like a telescope - move a few degrees and end up in a different galaxy. Do keep this in mind.
The Assumptions
The calculation above is very dependent on two assumptions. The first is the discount rate and the other is the cash flows. Part of investing is coming up with your own evaluation of a company's future performance, so try the calculation yourself and check your own assumptions. The DCF also does not consider the possible cyclicality of an industry, or a company's future capital requirements, so it does not give a full picture of a company's potential performance. Given that we are looking at Sinfonia TechnologyLtd as potential shareholders, the cost of equity is used as the discount rate, rather than the cost of capital (or weighted average cost of capital, WACC) which accounts for debt. In this calculation we've used 7.3%, which is based on a levered beta of 1.264. Beta is a measure of a stock's volatility, compared to the market as a whole. We get our beta from the industry average beta of globally comparable companies, with an imposed limit between 0.8 and 2.0, which is a reasonable range for a stable business.
SWOT Analysis for Sinfonia TechnologyLtd
Strength
- Debt is not viewed as a risk.
- Dividends are covered by earnings and cash flows.
Weakness
- Earnings declined over the past year.
- Dividend is low compared to the top 25% of dividend payers in the Electrical market.
Opportunity
- Annual earnings are forecast to grow faster than the Japanese market.
- Good value based on P/E ratio compared to estimated Fair P/E ratio.
Threat
- No apparent threats visible for 6507.
Looking Ahead:
Although the valuation of a company is important, it is only one of many factors that you need to assess for a company. DCF models are not the be-all and end-all of investment valuation. Instead the best use for a DCF model is to test certain assumptions and theories to see if they would lead to the company being undervalued or overvalued. For instance, if the terminal value growth rate is adjusted slightly, it can dramatically alter the overall result. For Sinfonia TechnologyLtd, we've put together three essential aspects you should look at:
- Risks: To that end, you should be aware of the 2 warning signs we've spotted with Sinfonia TechnologyLtd .
- Future Earnings: How does 6507's growth rate compare to its peers and the wider market? Dig deeper into the analyst consensus number for the upcoming years by interacting with our free analyst growth expectation chart.
- Other High Quality Alternatives: Do you like a good all-rounder? Explore our interactive list of high quality stocks to get an idea of what else is out there you may be missing!
PS. Simply Wall St updates its DCF calculation for every Japanese stock every day, so if you want to find the intrinsic value of any other stock just search here.
New: Manage All Your Stock Portfolios in One Place
We've created the ultimate portfolio companion for stock investors, and it's free.
• Connect an unlimited number of Portfolios and see your total in one currency
• Be alerted to new Warning Signs or Risks via email or mobile
• Track the Fair Value of your stocks
Have feedback on this article? Concerned about the content? Get in touch with us directly. Alternatively, email editorial-team (at) simplywallst.com.
This article by Simply Wall St is general in nature. We provide commentary based on historical data and analyst forecasts only using an unbiased methodology and our articles are not intended to be financial advice. It does not constitute a recommendation to buy or sell any stock, and does not take account of your objectives, or your financial situation. We aim to bring you long-term focused analysis driven by fundamental data. Note that our analysis may not factor in the latest price-sensitive company announcements or qualitative material. Simply Wall St has no position in any stocks mentioned.
About TSE:6507
Flawless balance sheet with solid track record.
Similar Companies
Market Insights

Advertisement
Community Narratives

BMW cruising ahead with new EVs and premium models to boost revenue 5%
Fair Value €135.07|44.6% undervalued
UN
Community Contributor
EU#2 - From Humble Beginnings to Global Powerhouse
Fair Value DKK 851.04|46.4% undervalued
TO
Community Contributor