Advertisement
Is Now the Right Time to Reassess THK Shares After 78% Climb?

Simply Wall St
Reviewed by Simply Wall St
Trying to pin down whether now is the best time to buy, hold, or sell THK stock? You are not alone. With the stock closing at 4,050.0, and up a remarkable 78.0% over the past year, the journey has been anything but dull. Even year-to-date returns of 10.0% and a recent 0.6% weekly increase suggest that investor interest is still very much alive. This likely reflects optimism spurred by broader sector trends rather than any single news headline. At the same time, the 30-day movement shows a subtle dip of -0.1%, hinting at a touch of volatility as market sentiment shifts and recalibrates.
While THK’s long-term performance is impressive, the big question on many investors’ minds is this: does the current share price fairly reflect the company’s true worth, or is there still an opportunity for upside? Looking at a composite valuation score, where THK is undervalued in 0 out of 6 standard checks, the numbers suggest the stock may not be offering a clear value bargain according to traditional metrics.
Valuations are more than just numbers on a spreadsheet. Next, I will break down these valuation methods to see what is really driving this score and highlight an even more insightful way to think about THK’s true value, which is covered later in the article.
THK scores just 0/6 on our valuation checks. See what other red flags we found in the full valuation breakdown.Approach 1: THK Discounted Cash Flow (DCF) Analysis
The Discounted Cash Flow (DCF) model estimates a company's intrinsic value by projecting its future cash flows and discounting them back to their present value. This helps investors understand what the company’s underlying cash generation is worth today, based on expected growth and risk.
For THK, analysts estimate the company’s current Free Cash Flow at approximately ¥4.02 billion. Looking ahead, projections show this figure could rise to about ¥26.04 billion by 2029. While estimates from analysts extend up to five years, forecast values beyond that, including ten-year outlooks, are extrapolated using established methodologies.
Based on this model, the intrinsic value per share for THK is calculated at ¥3,746. With the current share price at ¥4,050, this suggests the stock is trading around 8.1% above its fair value. In other words, according to the DCF approach, THK shares appear modestly overvalued but not by a significant margin.
Result: ABOUT RIGHT
Head to the Valuation section of our Company Report for more details on how we arrive at this Fair Value for THK.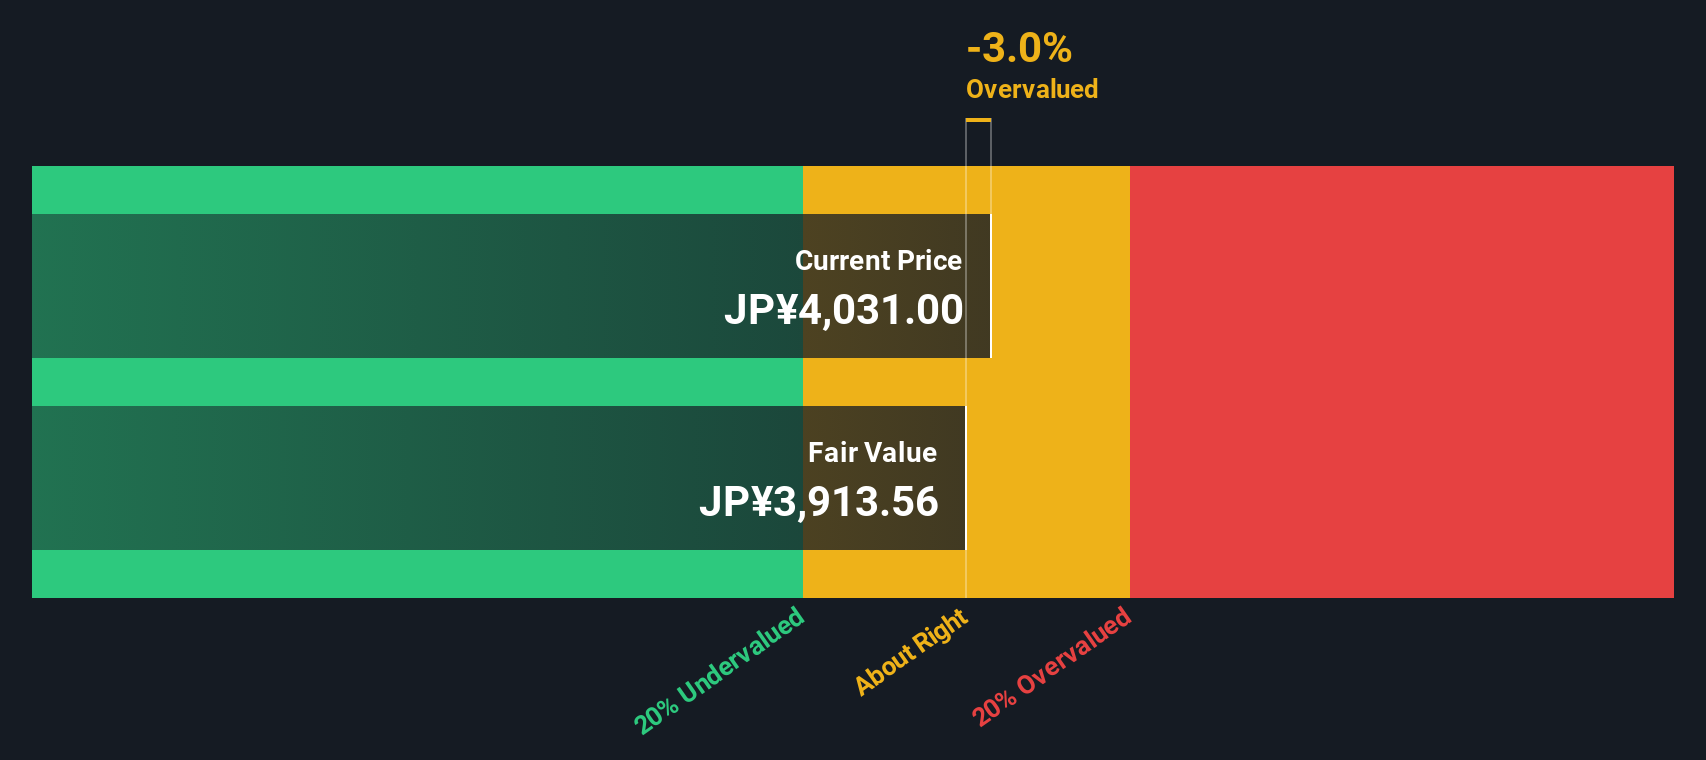
Approach 2: THK Price vs Earnings
The Price-to-Earnings (PE) ratio is one of the most widely used metrics for valuing profitable companies like THK, as it reflects what investors are willing to pay today for a unit of current earnings. This metric is especially useful because it anchors valuation to actual profitability, making it easier to compare companies across the industry.
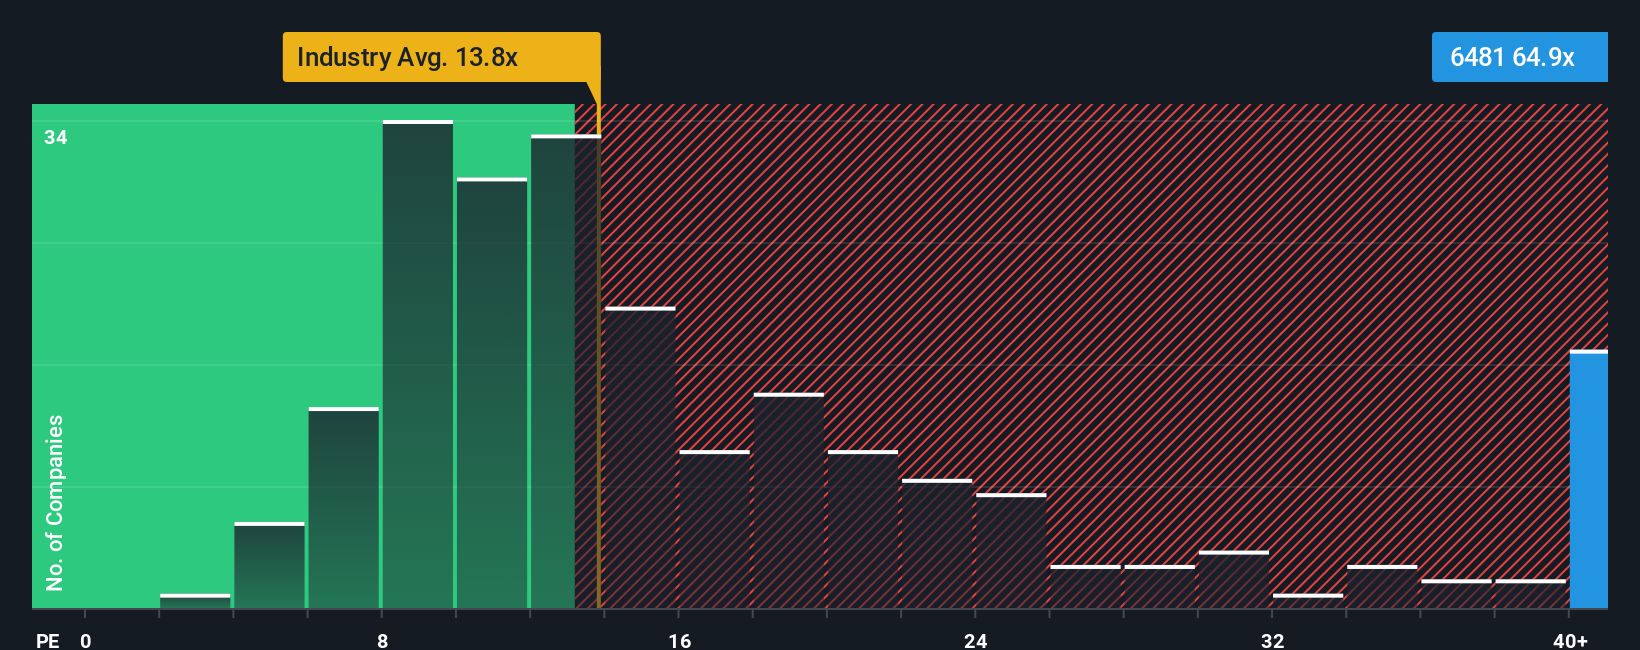
Higher growth expectations can justify a higher PE ratio, as investors anticipate rapid future earnings expansion, while greater risks usually demand a lower multiple. For THK, the current PE ratio stands at 65.3x, which is significantly higher than both the Machinery industry average of 13.5x and the peer group average of 34.9x. At first glance, this could signal the stock is on the expensive side.
Simply Wall St’s proprietary “Fair Ratio” addresses the limits of simple comparisons by factoring in THK's unique characteristics, including earnings growth prospects, profit margins, industry dynamics, company size, and specific risks. For THK, the Fair Ratio is calculated at 28.8x. This comprehensive metric adjusts for important variables, providing a better sense of what the market should genuinely pay for the stock rather than relying solely on generalized industry or peer multiples.
Comparing THK’s current PE of 65.3x to its Fair Ratio of 28.8x, the stock appears materially overvalued based on earnings.
Result: OVERVALUED
Upgrade Your Decision Making: Choose your THK Narrative
Earlier we mentioned that there is an even better way to understand valuation, so let’s introduce you to Narratives. A Narrative is simply your view of a company’s future. It is the story you create by combining your assumptions about THK’s prospects with the numbers: things like your fair value estimate, your expectations for future revenue and earnings growth, and what you think profit margins could look like.
By linking THK’s business story, whether it is bold automation drives, improved operational efficiency, or exposure to global cycles, to a clear forecast and fair value, Narratives help you see how your beliefs translate to a data-driven investment case.
Narratives are easy to use and accessible right now on Simply Wall St’s Community page, where millions of investors share and update their own perspectives in real time.
This approach makes buy and sell decisions clearer, because each Narrative calculates a fair value and shows exactly how it compares to today’s price. Because Narratives update with the latest news or earnings reports, you can always see what matters most for your thesis.
For example, some investors see THK reaching ¥5,310 per share with ambitious automation and growth plans, while others are more cautious, setting their sights closer to ¥2,800. This shows exactly how different stories create different valuations.
Do you think there's more to the story for THK? Create your own Narrative to let the Community know!
This article by Simply Wall St is general in nature. We provide commentary based on historical data and analyst forecasts only using an unbiased methodology and our articles are not intended to be financial advice. It does not constitute a recommendation to buy or sell any stock, and does not take account of your objectives, or your financial situation. We aim to bring you long-term focused analysis driven by fundamental data. Note that our analysis may not factor in the latest price-sensitive company announcements or qualitative material. Simply Wall St has no position in any stocks mentioned.
Valuation is complex, but we're here to simplify it.
Discover if THK might be undervalued or overvalued with our detailed analysis, featuring fair value estimates, potential risks, dividends, insider trades, and its financial condition.
Access Free AnalysisHave feedback on this article? Concerned about the content? Get in touch with us directly. Alternatively, email editorial-team@simplywallst.com
About TSE:6481
THK
Engages in the manufacture and sale of mechanical components worldwide.
Flawless balance sheet with moderate growth potential.
Similar Companies
Market Insights

Advertisement
Community Narratives
Quality at a Premium. A time to watch, not to buy?
Fair Value US$154.56|27.6% undervalued
DA
Community Contributor
GRAB: The Super-App at the Heart of Southeast Asia’s Digital Boom
Fair Value US$8.20|22.1% undervalued
BL
Community Contributor
Verve Group to Surge with 51.61% Revenue Growth
Fair Value €6.00|60.0% undervalued
ME
Community Contributor