Glory (TSE:6457) shares have shown some movement lately, catching the eye of investors who are monitoring the company’s recent performance history. Looking at key return figures over the past month and year, the stock’s trends present an interesting backdrop for further evaluation.
Glory’s 41.2% year-to-date share price gain hints at growing optimism, and the impressive 48.3% total shareholder return over the past year points to strong, sustained momentum carrying through both the near and longer term.
But with shares trading just shy of analysts’ price targets and after a strong run, the key question remains: is Glory still undervalued, or has the market already factored in future growth prospects?
Advertisement
Price-to-Earnings of 19x: Is it justified?
Glory’s current share price of ¥3,619 reflects a price-to-earnings (P/E) ratio of 19x, which looks expensive compared to both its peers and the broader industry. This premium raises questions about whether the market is assigning too much weight to its earnings profile at this stage.
The P/E ratio compares a company’s current share price to its per-share earnings and serves as a widely watched benchmark for valuation. For manufacturing companies like Glory, a higher P/E can suggest that investors expect stronger than average profit growth or a higher earnings quality.
At 19x, Glory trades at a notable premium versus the JP Machinery industry average of 13.2x and even more so compared to its direct peers averaging 11.1x. Investors are evidently willing to pay more for each yen of Glory’s earnings. However, the estimated fair P/E ratio, or what the market could revert towards, is 17.8x, highlighting that some optimism may already be factored in.
Another View: SWS DCF Model Suggests Undervaluation
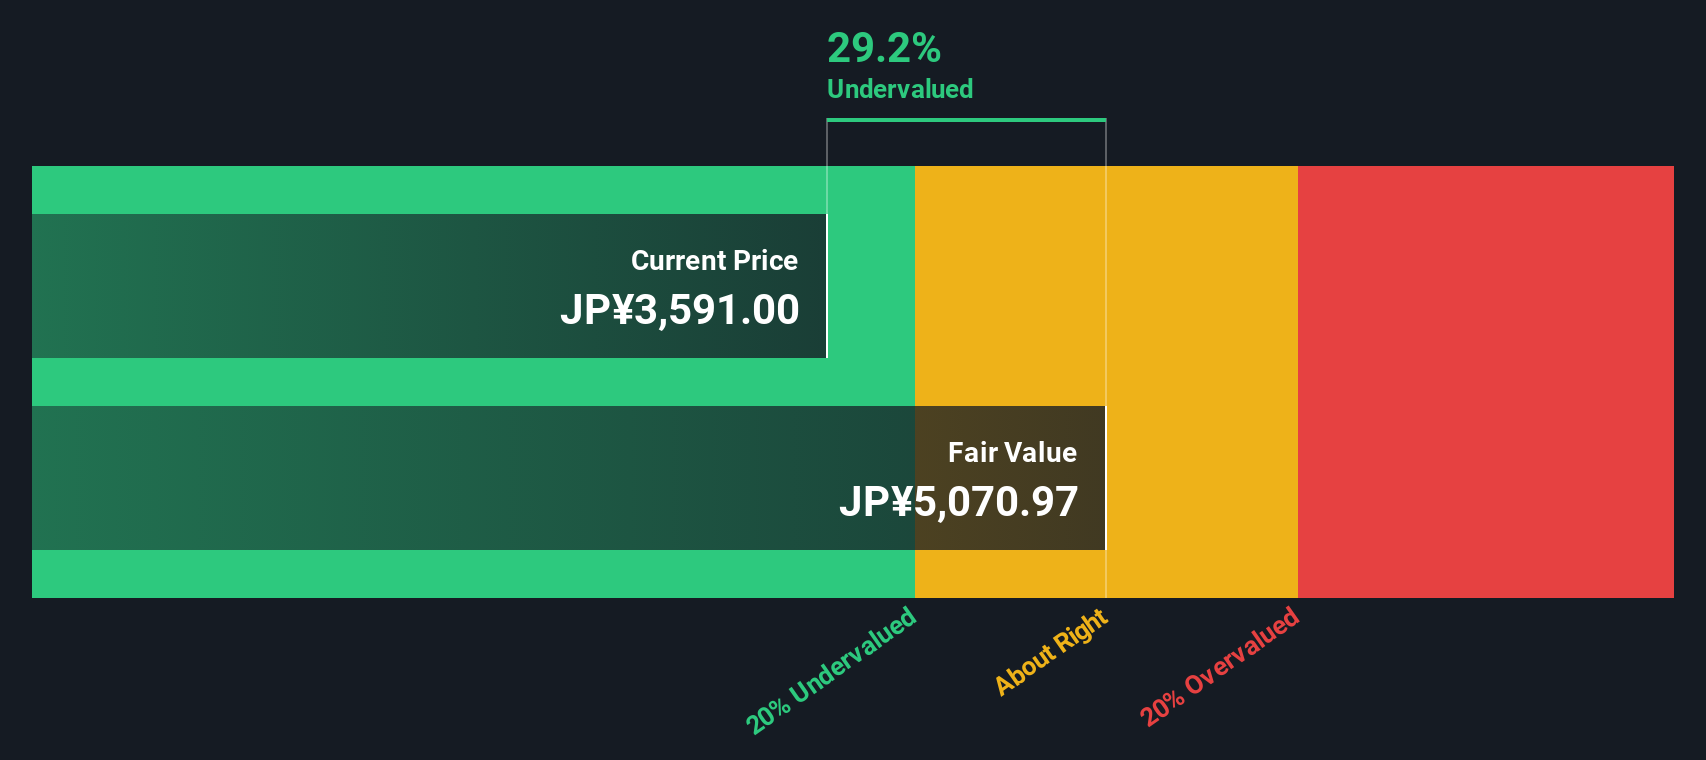
While Glory’s price-to-earnings ratio points to a premium valuation, our DCF model offers a different perspective. It suggests Glory could actually be trading around 29% below its estimated fair value. This indicates the stock may offer hidden potential if the assumptions hold.
Simply Wall St performs a discounted cash flow (DCF) on every stock in the world every day (check out Glory for example). We show the entire calculation in full. You can track the result in your watchlist or portfolio and be alerted when this changes, or use our stock screener to discover undervalued stocks based on their cash flows. If you save a screener we even alert you when new companies match - so you never miss a potential opportunity.
Build Your Own Glory Narrative
If you see the data differently or want to take a hands-on approach, building your own view of Glory is simple and only takes a few minutes, so why not Do it your way?
Don’t let your research end with Glory. Act now to find tomorrow’s winners with these handpicked screens that spotlight high-potential trends and under-the-radar opportunities.
Target promising breakthroughs by tracking these 33 healthcare AI stocks, a screen featuring companies at the forefront of medical innovation and AI-driven healthcare solutions.
This article by Simply Wall St is general in nature. We provide commentary based on historical data
and analyst forecasts only using an unbiased methodology and our articles are not intended to be financial advice. It does not constitute a recommendation to buy or sell any stock, and does not take account of your objectives, or your
financial situation. We aim to bring you long-term focused analysis driven by fundamental data.
Note that our analysis may not factor in the latest price-sensitive company announcements or qualitative material.
Simply Wall St has no position in any stocks mentioned.
New: Manage All Your Stock Portfolios in One Place
We've created the ultimate portfolio companion for stock investors, and it's free.
• Connect an unlimited number of Portfolios and see your total in one currency • Be alerted to new Warning Signs or Risks via email or mobile • Track the Fair Value of your stocks