Lacklustre Performance Is Driving Trinity Industrial Corporation's (TSE:6382) 35% Price Drop


The Trinity Industrial Corporation (TSE:6382) share price has fared very poorly over the last month, falling by a substantial 35%. Instead of being rewarded, shareholders who have already held through the last twelve months are now sitting on a 12% share price drop.
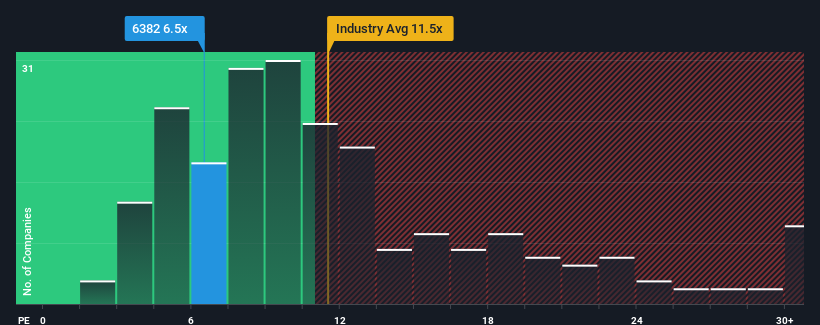
In spite of the heavy fall in price, given about half the companies in Japan have price-to-earnings ratios (or "P/E's") above 14x, you may still consider Trinity Industrial as a highly attractive investment with its 6.5x P/E ratio. However, the P/E might be quite low for a reason and it requires further investigation to determine if it's justified.
Earnings have risen firmly for Trinity Industrial recently, which is pleasing to see. It might be that many expect the respectable earnings performance to degrade substantially, which has repressed the P/E. If that doesn't eventuate, then existing shareholders have reason to be optimistic about the future direction of the share price.
See our latest analysis for Trinity Industrial
How Is Trinity Industrial's Growth Trending?
There's an inherent assumption that a company should far underperform the market for P/E ratios like Trinity Industrial's to be considered reasonable.
Taking a look back first, we see that the company grew earnings per share by an impressive 25% last year. The latest three year period has also seen a 17% overall rise in EPS, aided extensively by its short-term performance. Therefore, it's fair to say the earnings growth recently has been respectable for the company.
Weighing that recent medium-term earnings trajectory against the broader market's one-year forecast for expansion of 9.8% shows it's noticeably less attractive on an annualised basis.
In light of this, it's understandable that Trinity Industrial's P/E sits below the majority of other companies. It seems most investors are expecting to see the recent limited growth rates continue into the future and are only willing to pay a reduced amount for the stock.
The Final Word
Trinity Industrial's P/E looks about as weak as its stock price lately. We'd say the price-to-earnings ratio's power isn't primarily as a valuation instrument but rather to gauge current investor sentiment and future expectations.
As we suspected, our examination of Trinity Industrial revealed its three-year earnings trends are contributing to its low P/E, given they look worse than current market expectations. Right now shareholders are accepting the low P/E as they concede future earnings probably won't provide any pleasant surprises. Unless the recent medium-term conditions improve, they will continue to form a barrier for the share price around these levels.
It is also worth noting that we have found 4 warning signs for Trinity Industrial (1 shouldn't be ignored!) that you need to take into consideration.
If these risks are making you reconsider your opinion on Trinity Industrial, explore our interactive list of high quality stocks to get an idea of what else is out there.
If you're looking to trade Trinity Industrial, open an account with the lowest-cost platform trusted by professionals, Interactive Brokers.
With clients in over 200 countries and territories, and access to 160 markets, IBKR lets you trade stocks, options, futures, forex, bonds and funds from a single integrated account.
Enjoy no hidden fees, no account minimums, and FX conversion rates as low as 0.03%, far better than what most brokers offer.
Sponsored ContentValuation is complex, but we're here to simplify it.
Discover if Trinity Industrial might be undervalued or overvalued with our detailed analysis, featuring fair value estimates, potential risks, dividends, insider trades, and its financial condition.
Access Free AnalysisHave feedback on this article? Concerned about the content? Get in touch with us directly. Alternatively, email editorial-team (at) simplywallst.com.
This article by Simply Wall St is general in nature. We provide commentary based on historical data and analyst forecasts only using an unbiased methodology and our articles are not intended to be financial advice. It does not constitute a recommendation to buy or sell any stock, and does not take account of your objectives, or your financial situation. We aim to bring you long-term focused analysis driven by fundamental data. Note that our analysis may not factor in the latest price-sensitive company announcements or qualitative material. Simply Wall St has no position in any stocks mentioned.
Have feedback on this article? Concerned about the content? Get in touch with us directly. Alternatively, email editorial-team@simplywallst.com
About TSE:6382
Trinity Industrial
Designs, manufactures, sells, and installs coating plants, machinery, and industrial equipment in Japan.
Flawless balance sheet with proven track record and pays a dividend.
Market Insights

Community Narratives

