
Advertisement
Harmonic Drive Systems' (TSE:6324) Returns On Capital Tell Us There Is Reason To Feel Uneasy
If you're looking at a mature business that's past the growth phase, what are some of the underlying trends that pop up? Typically, we'll see the trend of both return on capital employed (ROCE) declining and this usually coincides with a decreasing amount of capital employed. Basically the company is earning less on its investments and it is also reducing its total assets. On that note, looking into Harmonic Drive Systems (TSE:6324), we weren't too upbeat about how things were going.
Return On Capital Employed (ROCE): What Is It?
For those who don't know, ROCE is a measure of a company's yearly pre-tax profit (its return), relative to the capital employed in the business. Analysts use this formula to calculate it for Harmonic Drive Systems:
Return on Capital Employed = Earnings Before Interest and Tax (EBIT) ÷ (Total Assets - Current Liabilities)
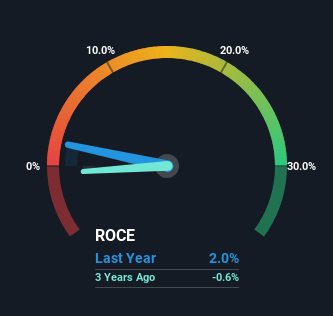
0.02 = JP¥2.8b ÷ (JP¥151b - JP¥12b) (Based on the trailing twelve months to December 2023).
Therefore, Harmonic Drive Systems has an ROCE of 2.0%. In absolute terms, that's a low return and it also under-performs the Machinery industry average of 7.9%.
Check out our latest analysis for Harmonic Drive Systems
In the above chart we have measured Harmonic Drive Systems' prior ROCE against its prior performance, but the future is arguably more important. If you're interested, you can view the analysts predictions in our free analyst report for Harmonic Drive Systems .
What The Trend Of ROCE Can Tell Us
There is reason to be cautious about Harmonic Drive Systems, given the returns are trending downwards. To be more specific, the ROCE was 13% five years ago, but since then it has dropped noticeably. On top of that, it's worth noting that the amount of capital employed within the business has remained relatively steady. Companies that exhibit these attributes tend to not be shrinking, but they can be mature and facing pressure on their margins from competition. So because these trends aren't typically conducive to creating a multi-bagger, we wouldn't hold our breath on Harmonic Drive Systems becoming one if things continue as they have.
In Conclusion...
In the end, the trend of lower returns on the same amount of capital isn't typically an indication that we're looking at a growth stock. It should come as no surprise then that the stock has fallen 10% over the last five years, so it looks like investors are recognizing these changes. Unless there is a shift to a more positive trajectory in these metrics, we would look elsewhere.
If you'd like to know about the risks facing Harmonic Drive Systems, we've discovered 2 warning signs that you should be aware of.
While Harmonic Drive Systems isn't earning the highest return, check out this free list of companies that are earning high returns on equity with solid balance sheets.
Valuation is complex, but we're here to simplify it.
Discover if Harmonic Drive Systems might be undervalued or overvalued with our detailed analysis, featuring fair value estimates, potential risks, dividends, insider trades, and its financial condition.
Access Free AnalysisHave feedback on this article? Concerned about the content? Get in touch with us directly. Alternatively, email editorial-team (at) simplywallst.com.
This article by Simply Wall St is general in nature. We provide commentary based on historical data and analyst forecasts only using an unbiased methodology and our articles are not intended to be financial advice. It does not constitute a recommendation to buy or sell any stock, and does not take account of your objectives, or your financial situation. We aim to bring you long-term focused analysis driven by fundamental data. Note that our analysis may not factor in the latest price-sensitive company announcements or qualitative material. Simply Wall St has no position in any stocks mentioned.
About TSE:6324
Harmonic Drive Systems
Produces and sells precision control equipment and components worldwide.
Excellent balance sheet with reasonable growth potential.
Similar Companies
Market Insights

Advertisement
Community Narratives
The company that turned a verb into a global necessity and basically runs the modern internet, digital ads, smartphones, maps, and AI.
Fair Value US$300.00|7.5% undervalued
OS
Community Contributor
Flowers Foods Pays A Fair Price For Health
Fair Value US$16.12|25.4% undervalued
NV
Community Contributor
TMX Group will thrive with 33.3% profit margin and enduring market moat
Fair Value CA$49.90|3.6% overvalued
LI
Community Contributor
The "Molecular Pencil": Why Beam's Technology is Built to Win
Fair Value US$65.01|65.0% undervalued
DA
Community Contributor