
Advertisement
Declining Stock and Decent Financials: Is The Market Wrong About SMC Corporation (TSE:6273)?

It is hard to get excited after looking at SMC's (TSE:6273) recent performance, when its stock has declined 25% over the past three months. However, stock prices are usually driven by a company’s financials over the long term, which in this case look pretty respectable. Particularly, we will be paying attention to SMC's ROE today.
Return on Equity or ROE is a test of how effectively a company is growing its value and managing investors’ money. In simpler terms, it measures the profitability of a company in relation to shareholder's equity.
How Do You Calculate Return On Equity?
ROE can be calculated by using the formula:
Return on Equity = Net Profit (from continuing operations) ÷ Shareholders' Equity
So, based on the above formula, the ROE for SMC is:
8.3% = JP¥162b ÷ JP¥1.9t (Based on the trailing twelve months to December 2024).
The 'return' is the profit over the last twelve months. So, this means that for every ¥1 of its shareholder's investments, the company generates a profit of ¥0.08.
View our latest analysis for SMC
What Is The Relationship Between ROE And Earnings Growth?
Thus far, we have learned that ROE measures how efficiently a company is generating its profits. Depending on how much of these profits the company reinvests or "retains", and how effectively it does so, we are then able to assess a company’s earnings growth potential. Generally speaking, other things being equal, firms with a high return on equity and profit retention, have a higher growth rate than firms that don’t share these attributes.
SMC's Earnings Growth And 8.3% ROE
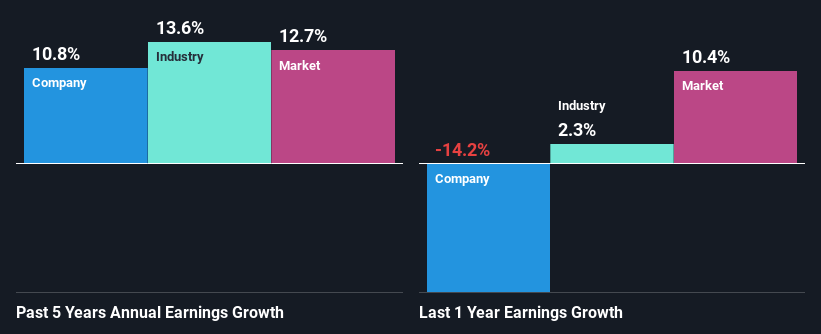
When you first look at it, SMC's ROE doesn't look that attractive. However, its ROE is similar to the industry average of 7.5%, so we won't completely dismiss the company. Having said that, SMC has shown a modest net income growth of 11% over the past five years. Considering the moderately low ROE, it is quite possible that there might be some other aspects that are positively influencing the company's earnings growth. For example, it is possible that the company's management has made some good strategic decisions, or that the company has a low payout ratio.
As a next step, we compared SMC's net income growth with the industry and were disappointed to see that the company's growth is lower than the industry average growth of 14% in the same period.
Earnings growth is an important metric to consider when valuing a stock. It’s important for an investor to know whether the market has priced in the company's expected earnings growth (or decline). By doing so, they will have an idea if the stock is headed into clear blue waters or if swampy waters await. If you're wondering about SMC's's valuation, check out this gauge of its price-to-earnings ratio , as compared to its industry.
Is SMC Using Its Retained Earnings Effectively?
SMC has a healthy combination of a moderate three-year median payout ratio of 29% (or a retention ratio of 71%) and a respectable amount of growth in earnings as we saw above, meaning that the company has been making efficient use of its profits.
Additionally, SMC has paid dividends over a period of at least ten years which means that the company is pretty serious about sharing its profits with shareholders.
Summary
In total, it does look like SMC has some positive aspects to its business. Specifically, its fairly high earnings growth number, which no doubt was backed by the company's high earnings retention. Still, the low ROE means that all that reinvestment is not reaping a lot of benefit to the investors. With that said, the latest industry analyst forecasts reveal that the company's earnings growth is expected to slow down. To know more about the latest analysts predictions for the company, check out this visualization of analyst forecasts for the company.
New: Manage All Your Stock Portfolios in One Place
We've created the ultimate portfolio companion for stock investors, and it's free.
• Connect an unlimited number of Portfolios and see your total in one currency
• Be alerted to new Warning Signs or Risks via email or mobile
• Track the Fair Value of your stocks
Have feedback on this article? Concerned about the content? Get in touch with us directly. Alternatively, email editorial-team (at) simplywallst.com.
This article by Simply Wall St is general in nature. We provide commentary based on historical data and analyst forecasts only using an unbiased methodology and our articles are not intended to be financial advice. It does not constitute a recommendation to buy or sell any stock, and does not take account of your objectives, or your financial situation. We aim to bring you long-term focused analysis driven by fundamental data. Note that our analysis may not factor in the latest price-sensitive company announcements or qualitative material. Simply Wall St has no position in any stocks mentioned.
About TSE:6273
SMC
Manufactures, processes, and sells automatic control equipment, sintered filters, and various types of filtration equipment worldwide.
Flawless balance sheet average dividend payer.
Similar Companies
Market Insights

Advertisement
Community Narratives
MicroStrategy: Volatile Gamble or Golden Opportunity?
Fair Value US$663.00|31.9% undervalued
BL
Community Contributor
Emerging Markets and Debt Reduction Will Propel Bath & Body Works Forward
Fair Value US$40.73|22.1% undervalued
ZW
Community Contributor
An amazing opportunity to potentially get a 100 bagger
Fair Value US$10.00|36.0% overvalued
DA
Community Contributor