Seibu Electric & Machinery Co., Ltd. (TSE:6144) May Have Run Too Fast Too Soon With Recent 32% Price Plummet


Seibu Electric & Machinery Co., Ltd. (TSE:6144) shares have had a horrible month, losing 32% after a relatively good period beforehand. The last month has meant the stock is now only up 9.4% during the last year.
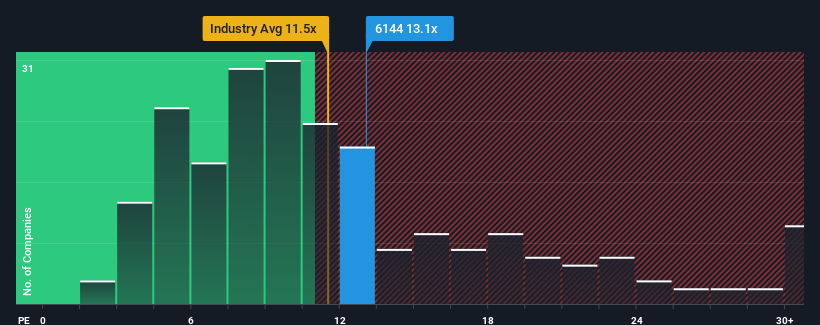
Even after such a large drop in price, you could still be forgiven for feeling indifferent about Seibu Electric & Machinery's P/E ratio of 13.1x, since the median price-to-earnings (or "P/E") ratio in Japan is also close to 13x. However, investors might be overlooking a clear opportunity or potential setback if there is no rational basis for the P/E.
For example, consider that Seibu Electric & Machinery's financial performance has been poor lately as its earnings have been in decline. It might be that many expect the company to put the disappointing earnings performance behind them over the coming period, which has kept the P/E from falling. If you like the company, you'd at least be hoping this is the case so that you could potentially pick up some stock while it's not quite in favour.
View our latest analysis for Seibu Electric & Machinery
What Are Growth Metrics Telling Us About The P/E?
Seibu Electric & Machinery's P/E ratio would be typical for a company that's only expected to deliver moderate growth, and importantly, perform in line with the market.
Taking a look back first, the company's earnings per share growth last year wasn't something to get excited about as it posted a disappointing decline of 10%. Unfortunately, that's brought it right back to where it started three years ago with EPS growth being virtually non-existent overall during that time. Accordingly, shareholders probably wouldn't have been overly satisfied with the unstable medium-term growth rates.
This is in contrast to the rest of the market, which is expected to grow by 9.8% over the next year, materially higher than the company's recent medium-term annualised growth rates.
In light of this, it's curious that Seibu Electric & Machinery's P/E sits in line with the majority of other companies. It seems most investors are ignoring the fairly limited recent growth rates and are willing to pay up for exposure to the stock. Maintaining these prices will be difficult to achieve as a continuation of recent earnings trends is likely to weigh down the shares eventually.
What We Can Learn From Seibu Electric & Machinery's P/E?
Following Seibu Electric & Machinery's share price tumble, its P/E is now hanging on to the median market P/E. Using the price-to-earnings ratio alone to determine if you should sell your stock isn't sensible, however it can be a practical guide to the company's future prospects.
Our examination of Seibu Electric & Machinery revealed its three-year earnings trends aren't impacting its P/E as much as we would have predicted, given they look worse than current market expectations. Right now we are uncomfortable with the P/E as this earnings performance isn't likely to support a more positive sentiment for long. Unless the recent medium-term conditions improve, it's challenging to accept these prices as being reasonable.
You always need to take note of risks, for example - Seibu Electric & Machinery has 1 warning sign we think you should be aware of.
If P/E ratios interest you, you may wish to see this free collection of other companies with strong earnings growth and low P/E ratios.
New: Manage All Your Stock Portfolios in One Place
We've created the ultimate portfolio companion for stock investors, and it's free.
• Connect an unlimited number of Portfolios and see your total in one currency
• Be alerted to new Warning Signs or Risks via email or mobile
• Track the Fair Value of your stocks
Have feedback on this article? Concerned about the content? Get in touch with us directly. Alternatively, email editorial-team (at) simplywallst.com.
This article by Simply Wall St is general in nature. We provide commentary based on historical data and analyst forecasts only using an unbiased methodology and our articles are not intended to be financial advice. It does not constitute a recommendation to buy or sell any stock, and does not take account of your objectives, or your financial situation. We aim to bring you long-term focused analysis driven by fundamental data. Note that our analysis may not factor in the latest price-sensitive company announcements or qualitative material. Simply Wall St has no position in any stocks mentioned.
Have feedback on this article? Concerned about the content? Get in touch with us directly. Alternatively, email editorial-team@simplywallst.com
About TSE:6144
Excellent balance sheet established dividend payer.
Market Insights

Community Narratives


