
Advertisement

Some say volatility, rather than debt, is the best way to think about risk as an investor, but Warren Buffett famously said that 'Volatility is far from synonymous with risk.' So it might be obvious that you need to consider debt, when you think about how risky any given stock is, because too much debt can sink a company. We note that Sodick Co., Ltd. (TSE:6143) does have debt on its balance sheet. But is this debt a concern to shareholders?
What Risk Does Debt Bring?
Debt assists a business until the business has trouble paying it off, either with new capital or with free cash flow. In the worst case scenario, a company can go bankrupt if it cannot pay its creditors. However, a more common (but still painful) scenario is that it has to raise new equity capital at a low price, thus permanently diluting shareholders. Of course, debt can be an important tool in businesses, particularly capital heavy businesses. The first step when considering a company's debt levels is to consider its cash and debt together.
See our latest analysis for Sodick
What Is Sodick's Net Debt?
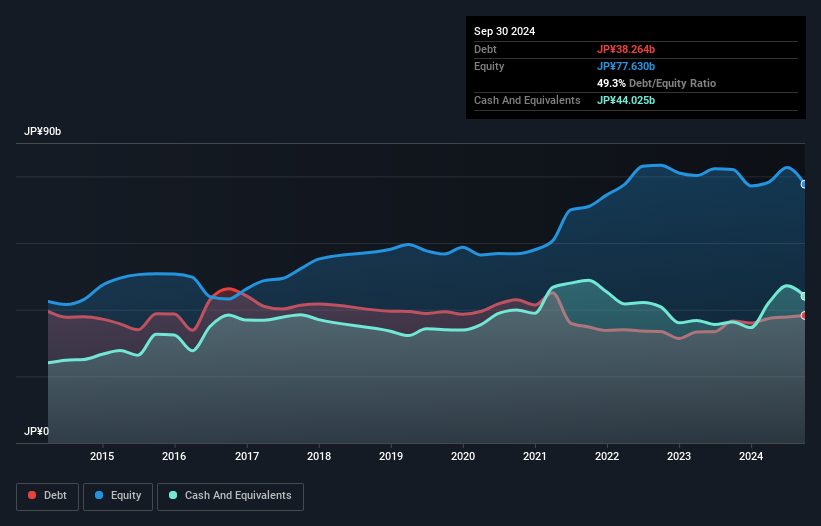
You can click the graphic below for the historical numbers, but it shows that as of September 2024 Sodick had JP¥38.3b of debt, an increase on JP¥36.6b, over one year. However, its balance sheet shows it holds JP¥44.0b in cash, so it actually has JP¥5.76b net cash.
How Strong Is Sodick's Balance Sheet?
Zooming in on the latest balance sheet data, we can see that Sodick had liabilities of JP¥33.3b due within 12 months and liabilities of JP¥27.4b due beyond that. Offsetting these obligations, it had cash of JP¥44.0b as well as receivables valued at JP¥14.7b due within 12 months. So it has liabilities totalling JP¥1.94b more than its cash and near-term receivables, combined.
Given Sodick has a market capitalization of JP¥40.7b, it's hard to believe these liabilities pose much threat. Having said that, it's clear that we should continue to monitor its balance sheet, lest it change for the worse. Despite its noteworthy liabilities, Sodick boasts net cash, so it's fair to say it does not have a heavy debt load! When analysing debt levels, the balance sheet is the obvious place to start. But it is future earnings, more than anything, that will determine Sodick's ability to maintain a healthy balance sheet going forward. So if you're focused on the future you can check out this free report showing analyst profit forecasts.
Over 12 months, Sodick made a loss at the EBIT level, and saw its revenue drop to JP¥68b, which is a fall of 3.4%. That's not what we would hope to see.
So How Risky Is Sodick?
Although Sodick had an earnings before interest and tax (EBIT) loss over the last twelve months, it generated positive free cash flow of JP¥504m. So although it is loss-making, it doesn't seem to have too much near-term balance sheet risk, keeping in mind the net cash. With revenue growth uninspiring, we'd really need to see some positive EBIT before mustering much enthusiasm for this business. The balance sheet is clearly the area to focus on when you are analysing debt. However, not all investment risk resides within the balance sheet - far from it. Case in point: We've spotted 1 warning sign for Sodick you should be aware of.
If, after all that, you're more interested in a fast growing company with a rock-solid balance sheet, then check out our list of net cash growth stocks without delay.
New: Manage All Your Stock Portfolios in One Place
We've created the ultimate portfolio companion for stock investors, and it's free.
• Connect an unlimited number of Portfolios and see your total in one currency
• Be alerted to new Warning Signs or Risks via email or mobile
• Track the Fair Value of your stocks
Have feedback on this article? Concerned about the content? Get in touch with us directly. Alternatively, email editorial-team (at) simplywallst.com.
This article by Simply Wall St is general in nature. We provide commentary based on historical data and analyst forecasts only using an unbiased methodology and our articles are not intended to be financial advice. It does not constitute a recommendation to buy or sell any stock, and does not take account of your objectives, or your financial situation. We aim to bring you long-term focused analysis driven by fundamental data. Note that our analysis may not factor in the latest price-sensitive company announcements or qualitative material. Simply Wall St has no position in any stocks mentioned.
About TSE:6143
Sodick
Engages in the development, manufacture, and sale of numerical control electric discharge machines (EDMs) in Japan and internationally.
Flawless balance sheet established dividend payer.
Market Insights

Advertisement
Community Narratives
Groundbreaking therapies that could change the treatment landscape for PTSD, fibromyalgia, MS & Alzheimer’s
Fair Value US$6.20|86.8% undervalued
CM
Community Contributor
DigitalOcean Will Grow 14% by Embracing AI with Paperspace Acquisition
Fair Value US$50.00|42.8% undervalued
NE
Community Contributor
Viant Technology: A Rising AdTech Challenger in the AI-Powered CTV Market
Fair Value US$38.61|61.4% undervalued
BL
Community Contributor
Volvo will Accelerate Forward into Electric and Autonomous Leadership in Five Years
Fair Value SEK 438.80|40.8% undervalued
UN
Community Contributor