
Advertisement
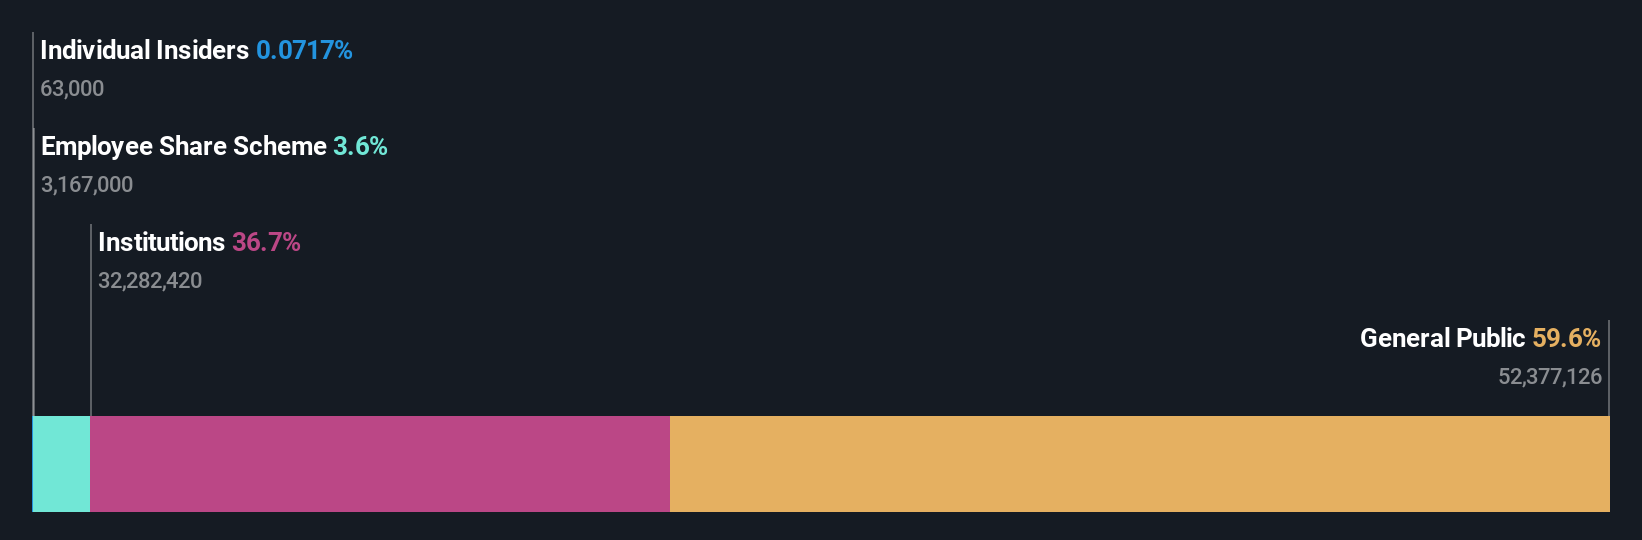
Fuji Corporation's (TSE:6134) 4.0% loss last week hit both individual investors who own 60% as well as institutions
Key Insights
- Fuji's significant individual investors ownership suggests that the key decisions are influenced by shareholders from the larger public
- The top 25 shareholders own 40% of the company
- 37% of Fuji is held by Institutions
Every investor in Fuji Corporation (TSE:6134) should be aware of the most powerful shareholder groups. The group holding the most number of shares in the company, around 60% to be precise, is individual investors. Put another way, the group faces the maximum upside potential (or downside risk).
While the holdings of individual investors took a hit after last week’s 4.0% price drop, institutions with their 37% holdings also suffered.
Let's take a closer look to see what the different types of shareholders can tell us about Fuji.
See our latest analysis for Fuji
What Does The Institutional Ownership Tell Us About Fuji?
Institutional investors commonly compare their own returns to the returns of a commonly followed index. So they generally do consider buying larger companies that are included in the relevant benchmark index.
We can see that Fuji does have institutional investors; and they hold a good portion of the company's stock. This implies the analysts working for those institutions have looked at the stock and they like it. But just like anyone else, they could be wrong. If multiple institutions change their view on a stock at the same time, you could see the share price drop fast. It's therefore worth looking at Fuji's earnings history below. Of course, the future is what really matters.
Hedge funds don't have many shares in Fuji. Nomura Asset Management Co., Ltd. is currently the company's largest shareholder with 5.3% of shares outstanding. In comparison, the second and third largest shareholders hold about 3.8% and 3.6% of the stock.
On studying our ownership data, we found that 25 of the top shareholders collectively own less than 50% of the share register, implying that no single individual has a majority interest.
Researching institutional ownership is a good way to gauge and filter a stock's expected performance. The same can be achieved by studying analyst sentiments. Quite a few analysts cover the stock, so you could look into forecast growth quite easily.
Insider Ownership Of Fuji
While the precise definition of an insider can be subjective, almost everyone considers board members to be insiders. The company management answer to the board and the latter should represent the interests of shareholders. Notably, sometimes top-level managers are on the board themselves.
Insider ownership is positive when it signals leadership are thinking like the true owners of the company. However, high insider ownership can also give immense power to a small group within the company. This can be negative in some circumstances.
Our data suggests that insiders own under 1% of Fuji Corporation in their own names. It's a big company, so even a small proportional interest can create alignment between the board and shareholders. In this case insiders own JP¥171m worth of shares. It is always good to see at least some insider ownership, but it might be worth checking if those insiders have been selling.
General Public Ownership
The general public, mostly comprising of individual investors, collectively holds 60% of Fuji shares. This level of ownership gives investors from the wider public some power to sway key policy decisions such as board composition, executive compensation, and the dividend payout ratio.
Next Steps:
It's always worth thinking about the different groups who own shares in a company. But to understand Fuji better, we need to consider many other factors. For instance, we've identified 2 warning signs for Fuji that you should be aware of.
Ultimately the future is most important. You can access this free report on analyst forecasts for the company.
NB: Figures in this article are calculated using data from the last twelve months, which refer to the 12-month period ending on the last date of the month the financial statement is dated. This may not be consistent with full year annual report figures.
New: AI Stock Screener & Alerts
Our new AI Stock Screener scans the market every day to uncover opportunities.
• Dividend Powerhouses (3%+ Yield)
• Undervalued Small Caps with Insider Buying
• High growth Tech and AI Companies
Or build your own from over 50 metrics.
Have feedback on this article? Concerned about the content? Get in touch with us directly. Alternatively, email editorial-team (at) simplywallst.com.
This article by Simply Wall St is general in nature. We provide commentary based on historical data and analyst forecasts only using an unbiased methodology and our articles are not intended to be financial advice. It does not constitute a recommendation to buy or sell any stock, and does not take account of your objectives, or your financial situation. We aim to bring you long-term focused analysis driven by fundamental data. Note that our analysis may not factor in the latest price-sensitive company announcements or qualitative material. Simply Wall St has no position in any stocks mentioned.
About TSE:6134
Fuji
Manufactures and sells electronic component mounting robots and machine tools in Japan.
Flawless balance sheet with proven track record.
Similar Companies
Market Insights

Advertisement
Community Narratives
MINISO's fair value is projected at 26.69 with an anticipated PE ratio shift of 20x
Fair Value US$24.03|11.0% undervalued
BE
Community Contributor
Procter & Gamble: A Dividend Giant Facing Slowing Growth
Fair Value US$119.81|23.3% overvalued
AN
Community Contributor
Eli Lilly's Future Growth Driven by Tirzepatide and Favorable Market Conditions
Fair Value US$1.19k|13.8% undervalued
EA
Community Contributor