Advertisement
Okuma (TSE:6103) Valuation in Focus After Latest Earnings and Dividend Guidance Update

Simply Wall St
Reviewed by Simply Wall St
Okuma (TSE:6103) recently revised its full-year earnings guidance and confirmed its dividend plans. This provides investors with a clearer view of expected sales, profits, and payouts for the period ending March 2026.
See our latest analysis for Okuma.
Okuma’s consistent updates on earnings guidance and dividends seem to have helped maintain investor confidence, even in a somewhat volatile market. The latest share price sits at ¥3,530, and while the 1-day share price return dipped 3.4%, the company still boasts a strong 1-year total shareholder return of nearly 20%. This highlights robust long-term performance despite short-term fluctuations.
If this momentum makes you curious about other opportunities, this could be the perfect moment to broaden your search and discover fast growing stocks with high insider ownership
With solid financial guidance and a steady dividend outlook now public, investors are likely asking themselves whether Okuma’s stock remains attractively valued or if the market has already priced in future growth potential.
Price-to-Earnings of 20.2x: Is it justified?
Based on a price-to-earnings (P/E) ratio of 20.2x and a recent close at ¥3,530, Okuma shares are trading at a valuation premium compared to its machinery peers. This signals that investors are paying more yen for each unit of earnings relative to other companies in the sector.
The price-to-earnings ratio reflects what investors are willing to pay today for a company’s future profit stream. For industrials like Okuma, the P/E can reveal whether the market has high hopes for profit growth or is cautious due to sector headwinds.
Currently, Okuma’s P/E of 20.2x is significantly above the Japanese machinery industry average of 13.5x and higher than the peer group average of 14.6x. Even when compared to its estimated fair value P/E ratio of 20.2x, the stock appears fully priced at best. Market optimism may be factoring in projected earnings growth, but there are questions whether this premium is sustainable, especially when put alongside industry norms. The fair ratio suggests the market could converge toward a more neutral valuation unless earnings impress consistently.
Explore the SWS fair ratio for Okuma
Result: Price-to-Earnings of 20.2x (OVERVALUED)
However, rising sector competition or any slowdown in annual revenue and income growth could challenge Okuma's ability to sustain its current valuation premium.
Find out about the key risks to this Okuma narrative.
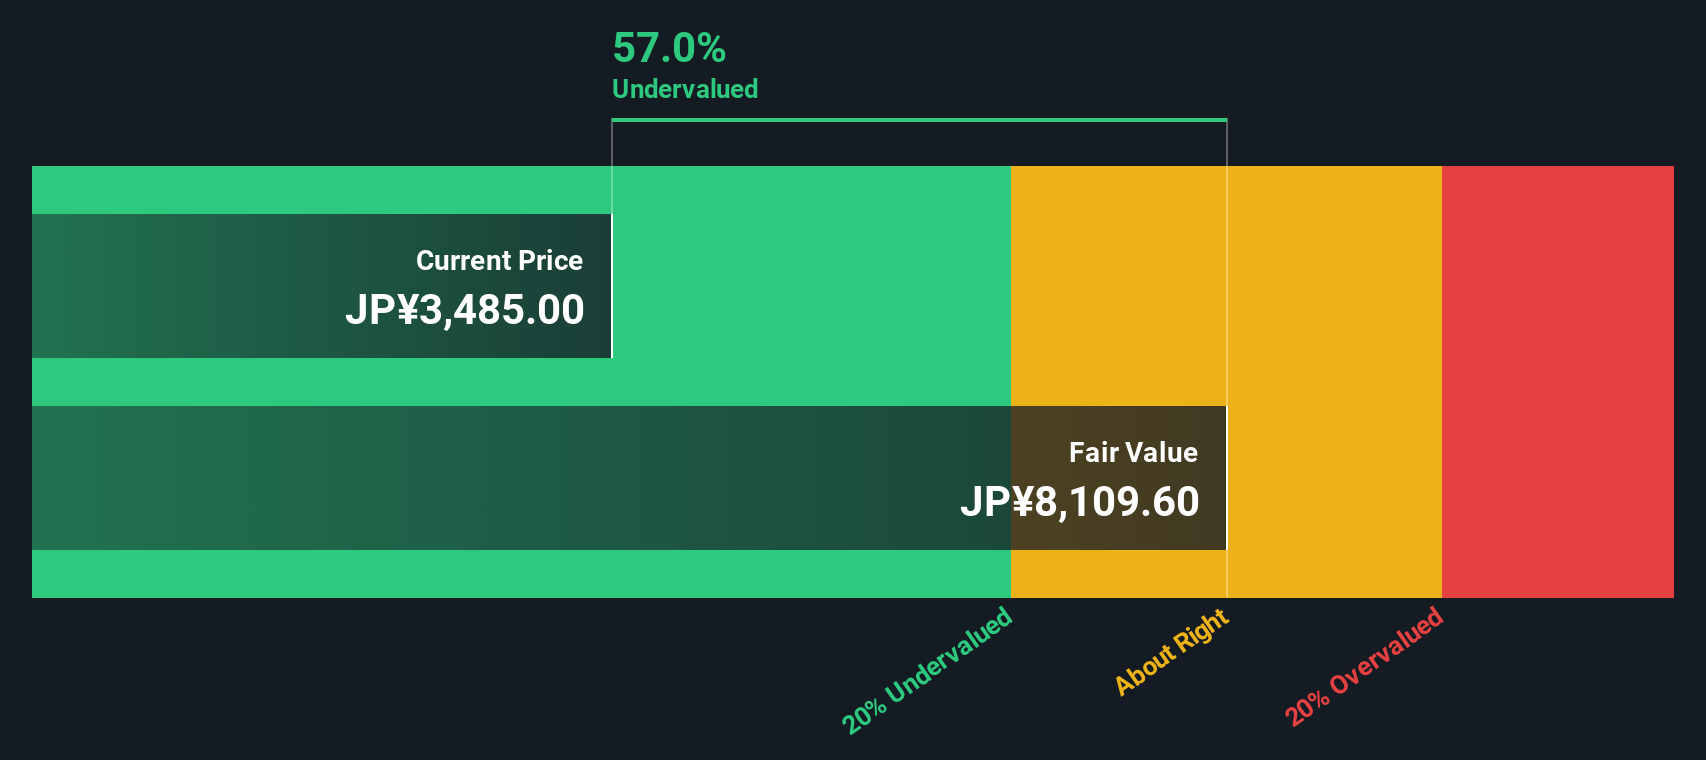
Another View: DCF Model Suggests Deep Value
While Okuma’s high price-to-earnings ratio suggests the stock is overvalued compared to peers, the SWS DCF model offers a different perspective. By estimating the present value of expected cash flows, DCF indicates that Okuma is actually trading at a steep discount to its intrinsic worth. Does this signal a hidden opportunity or highlight the challenges of forecasting future performance?
Look into how the SWS DCF model arrives at its fair value.
Simply Wall St performs a discounted cash flow (DCF) on every stock in the world every day (check out Okuma for example). We show the entire calculation in full. You can track the result in your watchlist or portfolio and be alerted when this changes, or use our stock screener to discover 874 undervalued stocks based on their cash flows. If you save a screener we even alert you when new companies match - so you never miss a potential opportunity.
Build Your Own Okuma Narrative
If you prefer drawing your own conclusions or delving deeper into the numbers, you can craft a personalized perspective in just a few minutes. Do it your way
A great starting point for your Okuma research is our analysis highlighting 2 key rewards and 1 important warning sign that could impact your investment decision.
Looking for more investment ideas?
Smart investors know the real opportunities are often just one step further. Don't wait to spot your next winner. Expand your search and seize the advantages others might overlook today.
- Tap into potential market game-changers with these 27 AI penny stocks in artificial intelligence advancements before the rest of the crowd catches on.
- Boost your passive income by securing positions in these 15 dividend stocks with yields > 3% that consistently deliver yields above 3%.
- Unlock fresh value opportunities with these 874 undervalued stocks based on cash flows where strong fundamentals and attractive pricing align.
This article by Simply Wall St is general in nature. We provide commentary based on historical data and analyst forecasts only using an unbiased methodology and our articles are not intended to be financial advice. It does not constitute a recommendation to buy or sell any stock, and does not take account of your objectives, or your financial situation. We aim to bring you long-term focused analysis driven by fundamental data. Note that our analysis may not factor in the latest price-sensitive company announcements or qualitative material. Simply Wall St has no position in any stocks mentioned.
New: AI Stock Screener & Alerts
Our new AI Stock Screener scans the market every day to uncover opportunities.
• Dividend Powerhouses (3%+ Yield)
• Undervalued Small Caps with Insider Buying
• High growth Tech and AI Companies
Or build your own from over 50 metrics.
Have feedback on this article? Concerned about the content? Get in touch with us directly. Alternatively, email editorial-team@simplywallst.com
About TSE:6103
Okuma
Manufactures and sells machine tools in Japan, the United States, Europe, and Asia/Pacific.
Excellent balance sheet second-rate dividend payer.
Similar Companies
Market Insights

Advertisement
Community Narratives
MINISO's fair value is projected at 26.69 with an anticipated PE ratio shift of 20x
Fair Value US$24.03|11.4% undervalued
BE
Community Contributor
Procter & Gamble: A Dividend Giant Facing Slowing Growth
Fair Value US$119.81|23.5% overvalued
AN
Community Contributor
Eli Lilly's Future Growth Driven by Tirzepatide and Favorable Market Conditions
Fair Value US$1.19k|14.0% undervalued
EA
Community Contributor